
- Start >
- Rivers >
- Discharge >
- Isar >
- Langengeisling >
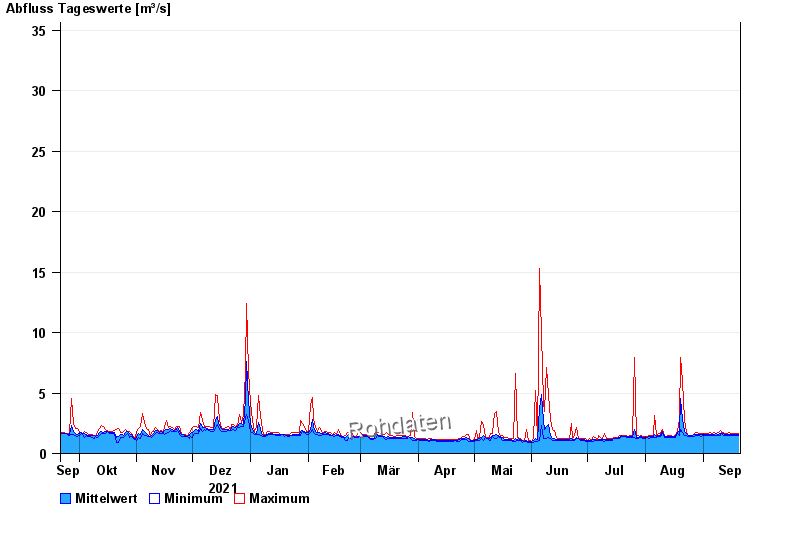
- Chart of year

Chart of year Langengeisling / Saubach
Discharge from 21.09.2021 to 20.09.2022
 Für diesen Pegel sind keine Jährlichkeiten hinterlegt.
| Date | Mean value [m³/s] | Maximum [m³/s] | Minimum [m³/s] |
|---|---|---|---|
| 20.09.2022 | 1.55 | 1.64 | 1.52 |
| 19.09.2022 | 1.57 | 1.64 | 1.52 |
| 18.09.2022 | 1.56 | 1.64 | 1.52 |
| 17.09.2022 | 1.54 | 1.64 | 1.52 |
| 16.09.2022 | 1.55 | 1.64 | 1.52 |
| 15.09.2022 | 1.55 | 1.76 | 1.52 |
| 14.09.2022 | 1.56 | 1.64 | 1.52 |
© Bayerisches Landesamt für Umwelt 2024