
- Start >
- Rivers >
- Discharge >
- Isar >
- Langengeisling >
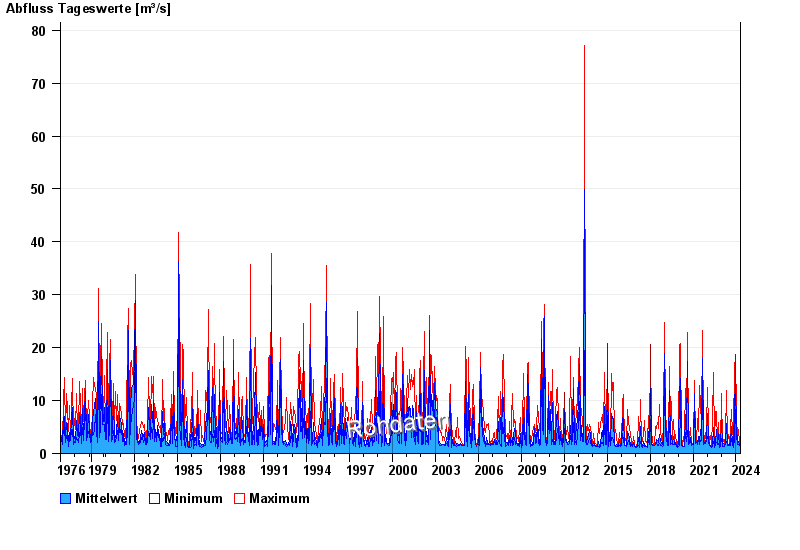
- Chart of total period

Chart of total period Langengeisling / Saubach
Discharge from 01.11.1976 to 25.04.2024
| Date | Mean value [m³/s] | Maximum [m³/s] | Minimum [m³/s] |
|---|---|---|---|
| 25.04.2024 | 1.47 | 1.59 | 1.37 |
| 24.04.2024 | 1.39 | 1.48 | 1.37 |
| 23.04.2024 | 1.37 | 1.37 | 1.37 |
| 22.04.2024 | 1.46 | 1.59 | 1.37 |
| 21.04.2024 | 1.4 | 1.48 | 1.37 |
| 20.04.2024 | 1.36 | 1.37 | 1.26 |
| 19.04.2024 | 1.37 | 1.48 | 1.26 |
© Bayerisches Landesamt für Umwelt 2024