
- Start >
- Rivers >
- Discharge >
- Isar >
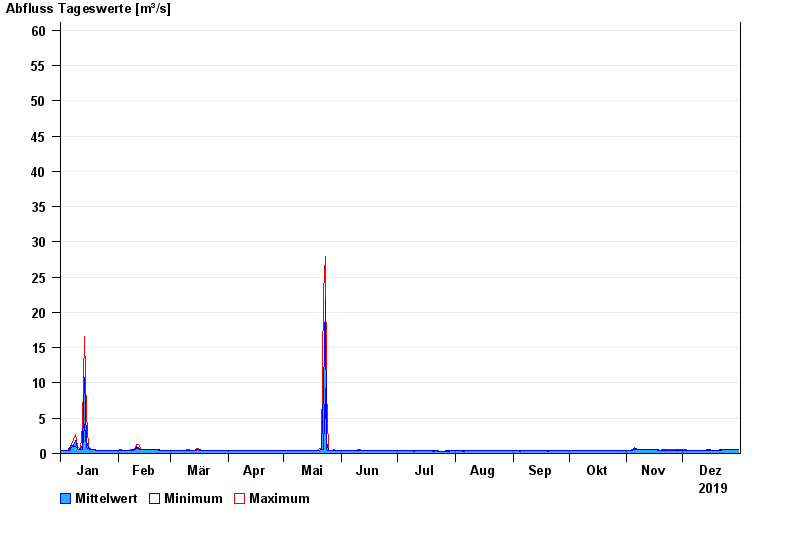
- Landshut Flutmulde >
- Chart of year

Chart of year Landshut Flutmulde / Isar
Discharge from 01.01.2019 to 31.12.2019
 Für diesen Pegel sind keine Jährlichkeiten hinterlegt.
| Date | Mean value [m³/s] | Maximum [m³/s] | Minimum [m³/s] |
|---|---|---|---|
| 31.12.2019 | 0.504 | 0.516 | 0.5 |
| 30.12.2019 | 0.504 | 0.516 | 0.5 |
| 29.12.2019 | 0.513 | 0.516 | 0.499 |
| 28.12.2019 | 0.519 | 0.531 | 0.515 |
| 27.12.2019 | 0.546 | 0.565 | 0.531 |
| 26.12.2019 | 0.589 | 0.603 | 0.565 |
| 25.12.2019 | 0.566 | 0.605 | 0.53 |
© Bayerisches Landesamt für Umwelt 2024