
- Start >
- Rivers >
- Discharge >
- Isar >
- Landshut Flutmulde >
- Chart of total period

Chart of total period Landshut Flutmulde / Isar
Discharge from 01.11.1976 to 25.04.2024
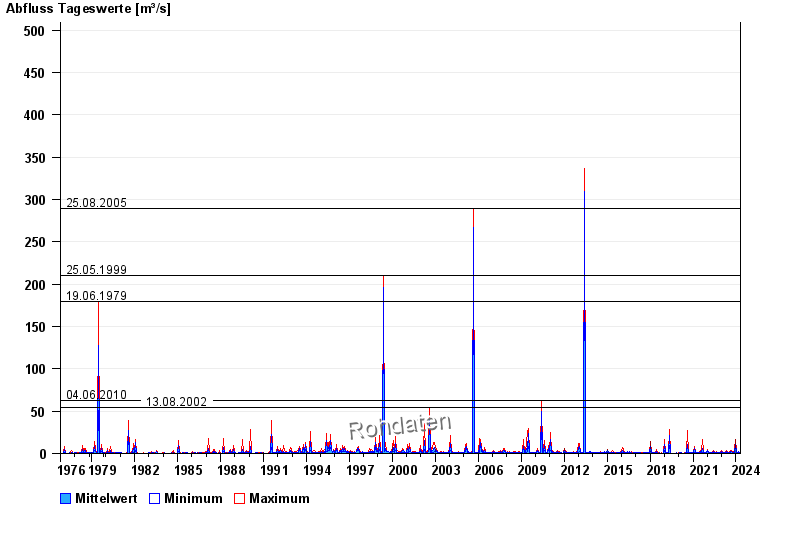
- 25.08.2005 Abfluss: 289 m³/s
- 25.05.1999 Abfluss: 210 m³/s
- 19.06.1979 Abfluss: 180 m³/s
- 04.06.2010 Abfluss: 62,1 m³/s
- 13.08.2002 Abfluss: 54,9 m³/s
| Date | Mean value [m³/s] | Maximum [m³/s] | Minimum [m³/s] |
|---|---|---|---|
| 25.04.2024 | 1.19 | 1.19 | 1.19 |
| 24.04.2024 | 1.18 | 1.19 | 1.16 |
| 23.04.2024 | 1.2 | 1.23 | 1.19 |
| 22.04.2024 | 1.33 | 1.38 | 1.23 |
| 21.04.2024 | 1.2 | 1.3 | 1.16 |
| 20.04.2024 | 1.18 | 1.19 | 1.16 |
| 19.04.2024 | 1.13 | 1.16 | 1.12 |
© Bayerisches Landesamt für Umwelt 2024