

Chart of total period Landau / Isar
Discharge from 01.11.1925 to 24.04.2024
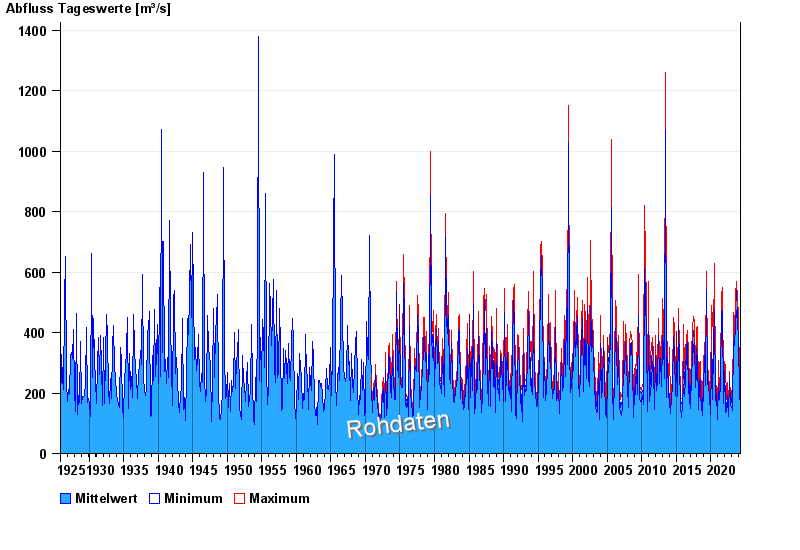
| Date | Mean value [m³/s] | Maximum [m³/s] | Minimum [m³/s] |
|---|---|---|---|
| 24.04.2024 | 171 | 178 | 168 |
| 23.04.2024 | 168 | 188 | 151 |
| 22.04.2024 | 167 | 188 | 148 |
| 21.04.2024 | 148 | 161 | 137 |
| 20.04.2024 | 151 | 161 | 144 |
| 19.04.2024 | 150 | 158 | 137 |
| 18.04.2024 | 155 | 165 | 137 |
© Bayerisches Landesamt für Umwelt 2024