

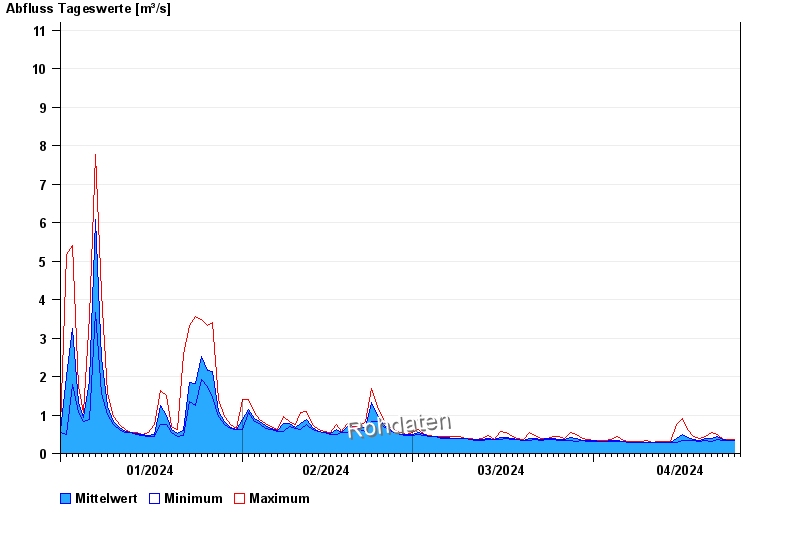
Chart of year Kollbach / Kollbach
Discharge from 01.01.2024 to 25.04.2024
- 10.06.1965 Abfluss: 49 m³/s
- 22.06.1965 Abfluss: 48,1 m³/s
- 01.06.1965 Abfluss: 45,9 m³/s
- 02.06.1995 Abfluss: 45,5 m³/s
- 15.02.1990 Abfluss: 44,4 m³/s
| Date | Mean value [m³/s] | Maximum [m³/s] | Minimum [m³/s] |
|---|---|---|---|
| 25.04.2024 | 0.331 | 0.333 | 0.277 |
| 24.04.2024 | 0.335 | 0.364 | 0.333 |
| 23.04.2024 | 0.361 | 0.364 | 0.333 |
| 22.04.2024 | 0.449 | 0.5 | 0.364 |
| 21.04.2024 | 0.377 | 0.538 | 0.304 |
| 20.04.2024 | 0.38 | 0.429 | 0.333 |
| 19.04.2024 | 0.326 | 0.395 | 0.304 |
© Bayerisches Landesamt für Umwelt 2024