

Chart of total period Kochel / Loisach
Discharge from 01.11.1910 to 25.04.2024
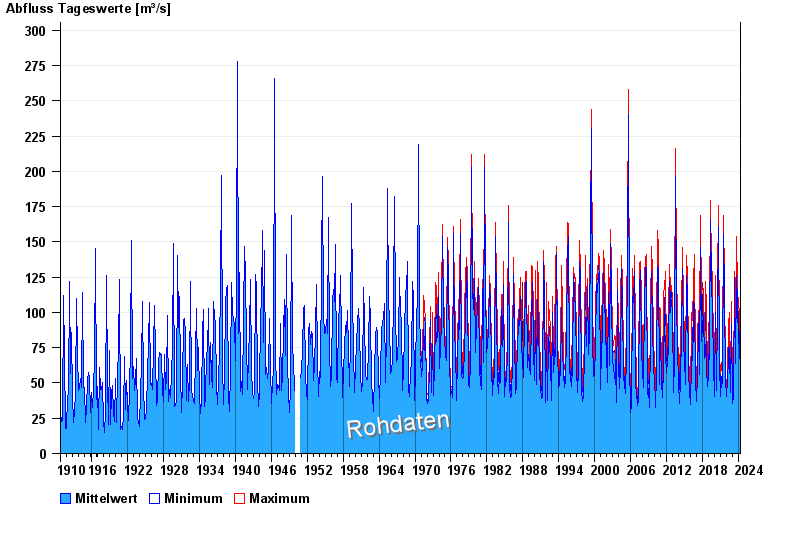
| Date | Mean value [m³/s] | Maximum [m³/s] | Minimum [m³/s] |
|---|---|---|---|
| 25.04.2024 | 46.8 | 48.7 | 45.4 |
| 24.04.2024 | 48.1 | 52 | 45.4 |
| 23.04.2024 | 59 | 67.6 | 45.4 |
| 22.04.2024 | 37.2 | 45.4 | 33.6 |
| 21.04.2024 | 32.8 | 35.6 | 31 |
| 20.04.2024 | 37 | 44.4 | 33.1 |
| 19.04.2024 | 41.3 | 47.6 | 38.7 |
© Bayerisches Landesamt für Umwelt 2024