

Chart of total period Kochel / Loisach
Discharge from 01.11.1910 to 20.04.2024
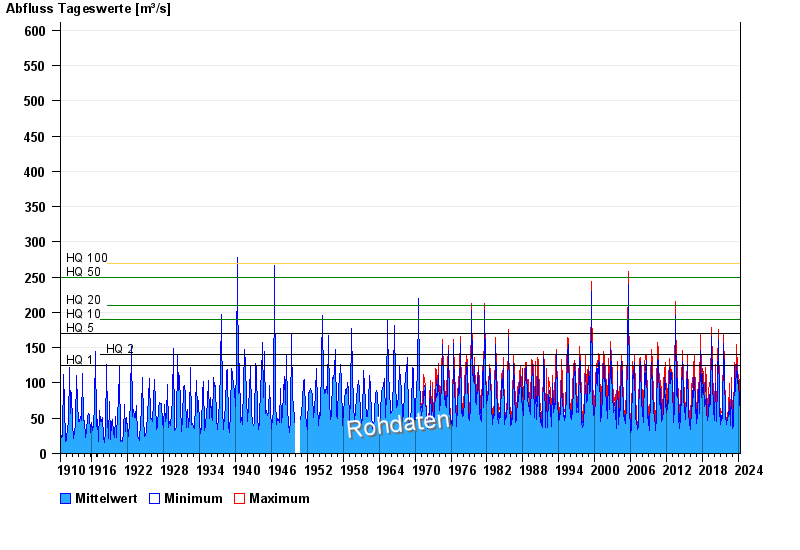
- HQ1 125 m³/s
- HQ2 140 m³/s
- HQ5 170 m³/s
- HQ10 190 m³/s
- HQ20 210 m³/s
- HQ50 250 m³/s
- HQ100 270 m³/s
| Date | Mean value [m³/s] | Maximum [m³/s] | Minimum [m³/s] |
|---|---|---|---|
| 20.04.2024 | 42.8 | 44.4 | 40.8 |
| 19.04.2024 | 41.3 | 47.6 | 38.7 |
| 18.04.2024 | 47.8 | 48.7 | 47 |
| 17.04.2024 | 42.5 | 46.5 | 38.7 |
| 16.04.2024 | 32.6 | 38.7 | 29 |
| 15.04.2024 | 28.4 | 31.5 | 25 |
| 14.04.2024 | 24.9 | 26.5 | 23.4 |
© Bayerisches Landesamt für Umwelt 2024