

Chart of total period Kirchberg / Mertseebach
Discharge from 01.11.1985 to 25.04.2024
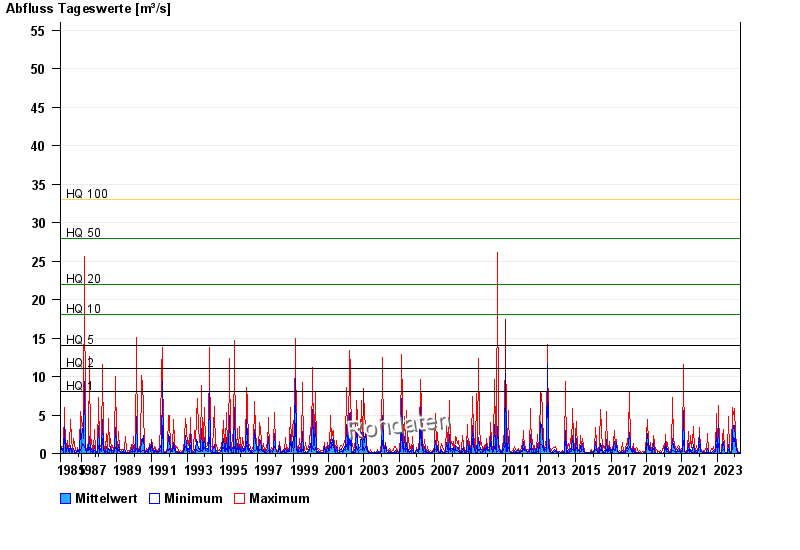
- HQ1 8 m³/s
- HQ2 11 m³/s
- HQ5 14 m³/s
- HQ10 18 m³/s
- HQ20 22 m³/s
- HQ50 28 m³/s
- HQ100 33 m³/s
| Date | Mean value [m³/s] | Maximum [m³/s] | Minimum [m³/s] |
|---|---|---|---|
| 25.04.2024 | 0.119 | 0.119 | 0.119 |
| 24.04.2024 | 0.108 | 0.119 | 0.106 |
| 23.04.2024 | 0.108 | 0.119 | 0.106 |
| 22.04.2024 | 0.121 | 0.134 | 0.106 |
| 21.04.2024 | 0.125 | 0.166 | 0.106 |
| 20.04.2024 | 0.121 | 0.134 | 0.119 |
| 19.04.2024 | 0.12 | 0.15 | 0.106 |
© Bayerisches Landesamt für Umwelt 2024