

Chart of year Kinning / Rott
Discharge from 01.01.2019 to 31.12.2019
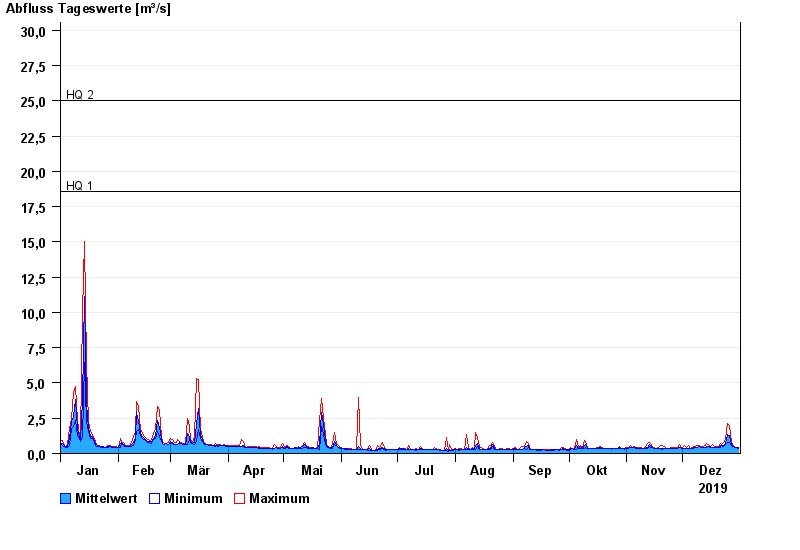
- HQ1 18,6 m³/s
- HQ2 25 m³/s
- HQ5 33 m³/s
- HQ10 39 m³/s
- HQ20 45 m³/s
- HQ50 53 m³/s
- HQ100 59 m³/s
| Date | Mean value [m³/s] | Maximum [m³/s] | Minimum [m³/s] |
|---|---|---|---|
| 31.12.2019 | 0.409 | 0.415 | 0.353 |
| 30.12.2019 | 0.414 | 0.414 | 0.414 |
| 29.12.2019 | 0.429 | 0.48 | 0.413 |
| 28.12.2019 | 0.51 | 0.551 | 0.479 |
| 27.12.2019 | 0.671 | 0.798 | 0.551 |
| 26.12.2019 | 1.26 | 1.98 | 0.797 |
| 25.12.2019 | 1.37 | 2.12 | 0.796 |
© Bayerisches Landesamt für Umwelt 2024