

Chart of year Kinning / Rott
Discharge from 01.01.2022 to 31.12.2022
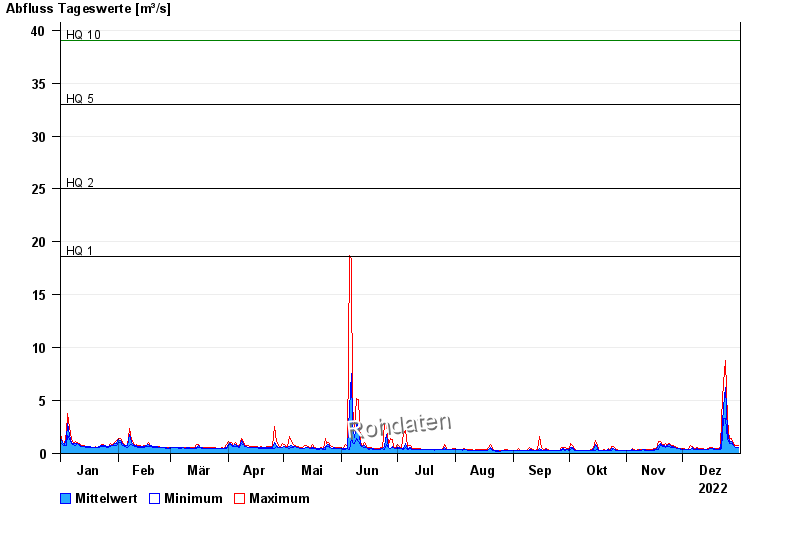
- HQ1 18,6 m³/s
- HQ2 25 m³/s
- HQ5 33 m³/s
- HQ10 39 m³/s
- HQ20 45 m³/s
- HQ50 53 m³/s
- HQ100 59 m³/s
| Date | Mean value [m³/s] | Maximum [m³/s] | Minimum [m³/s] |
|---|---|---|---|
| 31.12.2022 | 0.583 | 0.727 | 0.545 |
| 30.12.2022 | 0.596 | 0.727 | 0.545 |
| 29.12.2022 | 0.658 | 0.727 | 0.633 |
| 28.12.2022 | 0.803 | 0.93 | 0.727 |
| 27.12.2022 | 1.16 | 1.42 | 0.93 |
| 26.12.2022 | 1.18 | 1.29 | 0.93 |
| 25.12.2022 | 2.05 | 3.16 | 1.29 |
© Bayerisches Landesamt für Umwelt 2024