

Chart of total period Kinning / Rott
Discharge from 01.11.1973 to 25.04.2024
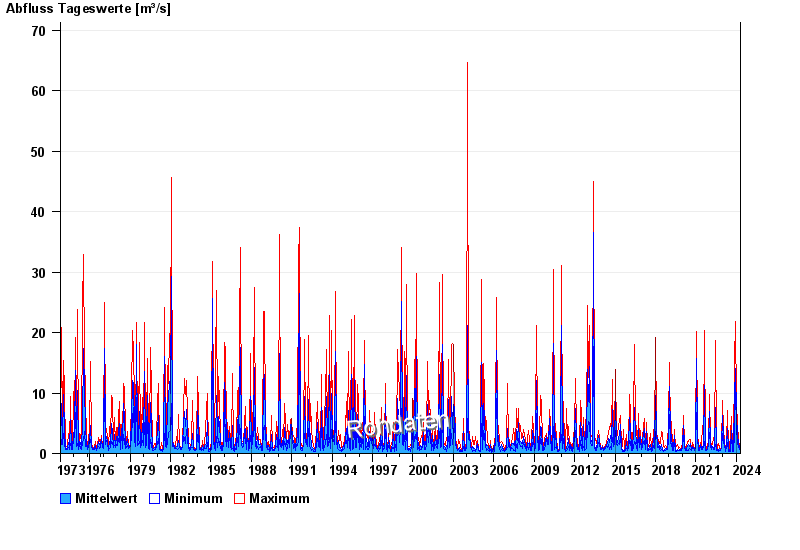
| Date | Mean value [m³/s] | Maximum [m³/s] | Minimum [m³/s] |
|---|---|---|---|
| 25.04.2024 | 0.8 | 0.876 | 0.785 |
| 24.04.2024 | 0.819 | 0.976 | 0.785 |
| 23.04.2024 | 0.937 | 1.19 | 0.876 |
| 22.04.2024 | 1.83 | 2.66 | 1.19 |
| 21.04.2024 | 0.897 | 2.66 | 0.615 |
| 20.04.2024 | 0.743 | 0.785 | 0.698 |
| 19.04.2024 | 0.67 | 0.785 | 0.615 |
© Bayerisches Landesamt für Umwelt 2024