
- Start >
- Rivers >
- Discharge >
- Isar >
- Hohenkammer >
- Chart of year

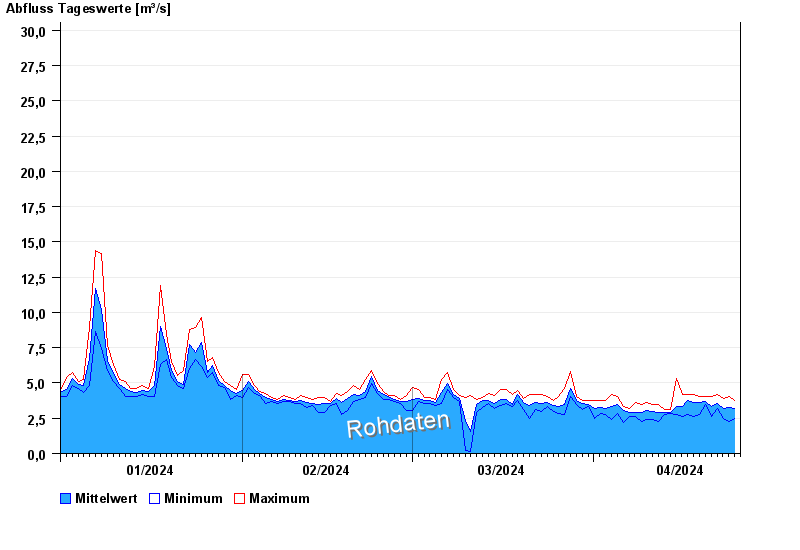
Chart of year Hohenkammer / Glonn
Discharge from 01.01.2024 to 25.04.2024
- HQ1 33 m³/s
- HQ2 41 m³/s
- HQ5 52 m³/s
- HQ10 66 m³/s
- HQ20 80 m³/s
- HQ50 100 m³/s
- HQ100 115 m³/s
| Date | Mean value [m³/s] | Maximum [m³/s] | Minimum [m³/s] |
|---|---|---|---|
| 25.04.2024 | 3.15 | 3.73 | 2.5 |
| 24.04.2024 | 3.26 | 4.01 | 2.29 |
| 23.04.2024 | 3.21 | 3.87 | 2.5 |
| 22.04.2024 | 3.57 | 4.15 | 3.21 |
| 21.04.2024 | 3.36 | 4.01 | 2.62 |
| 20.04.2024 | 3.71 | 4.01 | 3.46 |
| 19.04.2024 | 3.58 | 4.01 | 2.73 |
© Bayerisches Landesamt für Umwelt 2024