

Chart of year Hochberg / Traun
Discharge from 01.01.2020 to 31.12.2020
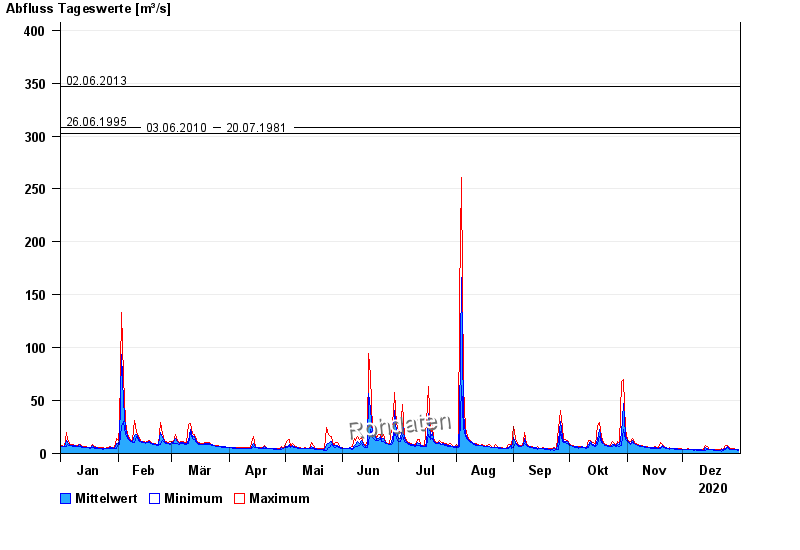
- 12.08.2002 Abfluss: 409 m³/s
- 02.06.2013 Abfluss: 347 m³/s
- 26.06.1995 Abfluss: 308 m³/s
- 03.06.2010 Abfluss: 302 m³/s
- 20.07.1981 Abfluss: 302 m³/s
| Date | Mean value [m³/s] | Maximum [m³/s] | Minimum [m³/s] |
|---|---|---|---|
| 31.12.2020 | 3.53 | 3.83 | 3.17 |
| 30.12.2020 | 3.67 | 4.08 | 3.38 |
| 29.12.2020 | 3.85 | 4.32 | 3.38 |
| 28.12.2020 | 4.11 | 4.85 | 3.6 |
| 27.12.2020 | 4.17 | 4.85 | 3.6 |
| 26.12.2020 | 4.82 | 5.69 | 4.08 |
| 25.12.2020 | 6.21 | 7.25 | 5.41 |
© Bayerisches Landesamt für Umwelt 2024