
- Start >
- Rivers >
- Discharge >
- Isar >
- Haunstetten >
- Chart of year

Chart of year Haunstetten / Lech
Discharge from 01.01.2019 to 31.12.2019
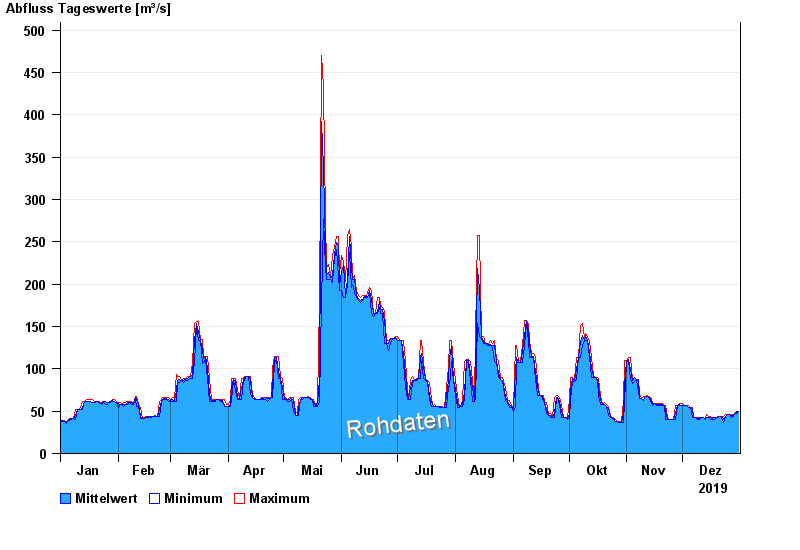
| Date | Mean value [m³/s] | Maximum [m³/s] | Minimum [m³/s] |
|---|---|---|---|
| 31.12.2019 | 49.2 | 49.2 | 49.2 |
| 30.12.2019 | 48.5 | 49.2 | 47.4 |
| 29.12.2019 | 47 | 47.4 | 45.7 |
| 28.12.2019 | 44.6 | 45.7 | 43.9 |
| 27.12.2019 | 44.9 | 45.7 | 42.1 |
| 26.12.2019 | 45.7 | 45.7 | 45.7 |
| 25.12.2019 | 45.7 | 45.7 | 45.7 |
© Bayerisches Landesamt für Umwelt 2024