
- Start >
- Rivers >
- Discharge >
- Isar >
- Haunstetten >
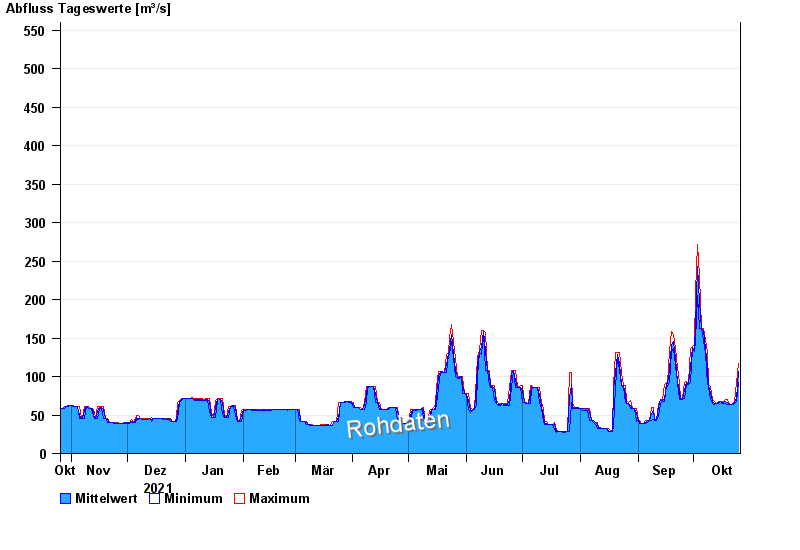
- Chart of year

Chart of year Haunstetten / Lech
Discharge from 26.10.2021 to 25.10.2022
 Für diesen Pegel sind keine Jährlichkeiten hinterlegt.
| Date | Mean value [m³/s] | Maximum [m³/s] | Minimum [m³/s] |
|---|---|---|---|
| 25.10.2022 | 106 | 117 | 91.9 |
| 24.10.2022 | 70.9 | 91.9 | 67.6 |
| 23.10.2022 | 67.3 | 67.6 | 65.5 |
| 22.10.2022 | 63.7 | 65.5 | 63.4 |
| 21.10.2022 | 63.4 | 63.4 | 63.4 |
| 20.10.2022 | 63.4 | 63.4 | 63.4 |
| 19.10.2022 | 66.2 | 69.7 | 63.4 |
© Bayerisches Landesamt für Umwelt 2024