

Chart of year Hammer / Oberteisendorfer Ache
Discharge from 18.10.2021 to 17.10.2022
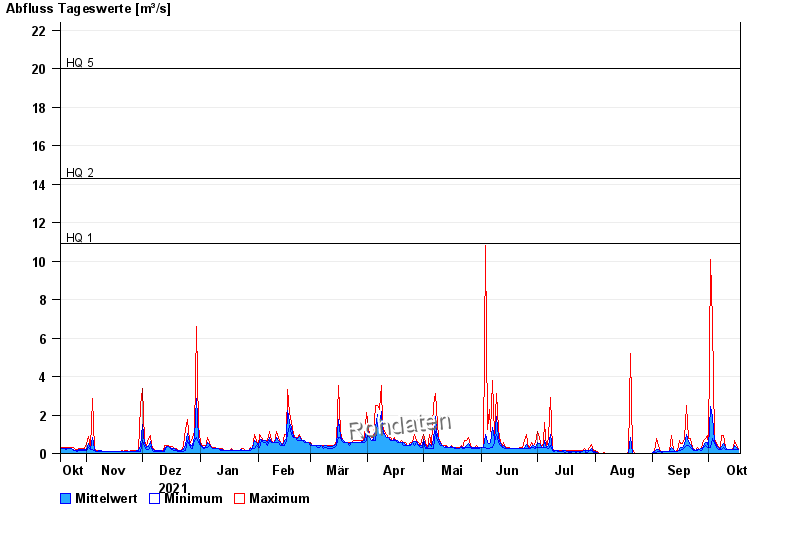
- HQ1 10,9 m³/s
- HQ2 14,3 m³/s
- HQ5 20 m³/s
- HQ10 25 m³/s
- HQ20 30 m³/s
- HQ50 39 m³/s
- HQ100 43 m³/s
| Date | Mean value [m³/s] | Maximum [m³/s] | Minimum [m³/s] |
|---|---|---|---|
| 17.10.2022 | 0.23 | 0.23 | 0.23 |
| 16.10.2022 | 0.294 | 0.407 | 0.23 |
| 15.10.2022 | 0.439 | 0.656 | 0.23 |
| 14.10.2022 | 0.232 | 0.307 | 0.23 |
| 13.10.2022 | 0.23 | 0.23 | 0.23 |
| 12.10.2022 | 0.23 | 0.23 | 0.23 |
| 11.10.2022 | 0.23 | 0.23 | 0.23 |
© Bayerisches Landesamt für Umwelt 2024