

Chart of year Hammer / Oberteisendorfer Ache
Discharge from 01.01.2020 to 31.12.2020
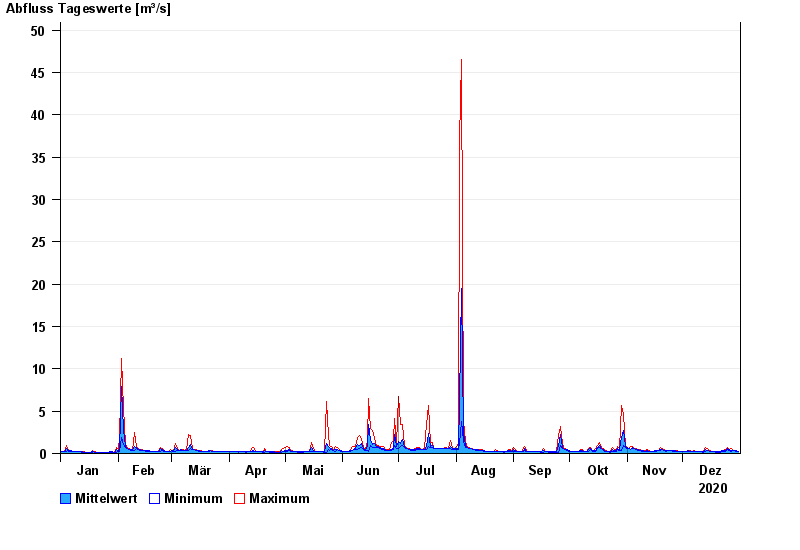
| Date | Mean value [m³/s] | Maximum [m³/s] | Minimum [m³/s] |
|---|---|---|---|
| 31.12.2020 | 0.282 | 0.282 | 0.282 |
| 30.12.2020 | 0.313 | 0.361 | 0.282 |
| 29.12.2020 | 0.361 | 0.361 | 0.361 |
| 28.12.2020 | 0.361 | 0.361 | 0.361 |
| 27.12.2020 | 0.376 | 0.569 | 0.282 |
| 26.12.2020 | 0.456 | 0.458 | 0.361 |
| 25.12.2020 | 0.621 | 0.694 | 0.458 |
© Bayerisches Landesamt für Umwelt 2024