

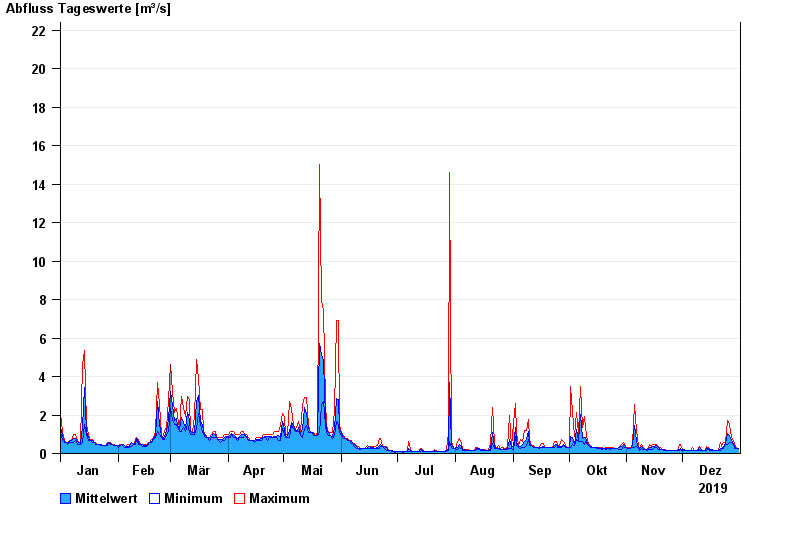
Chart of year Hammer / Oberteisendorfer Ache
Discharge from 01.01.2019 to 31.12.2019
- 04.08.2020 Abfluss: 46,5 m³/s
- 11.06.1971 Abfluss: 32,5 m³/s
- 12.08.2002 Abfluss: 32,2 m³/s
- 10.06.1965 Abfluss: 31,4 m³/s
- 26.06.1995 Abfluss: 25 m³/s
| Date | Mean value [m³/s] | Maximum [m³/s] | Minimum [m³/s] |
|---|---|---|---|
| 31.12.2019 | 0.283 | 0.283 | 0.282 |
| 30.12.2019 | 0.283 | 0.283 | 0.283 |
| 29.12.2019 | 0.358 | 0.45 | 0.283 |
| 28.12.2019 | 0.537 | 0.687 | 0.45 |
| 27.12.2019 | 0.683 | 0.825 | 0.562 |
| 26.12.2019 | 0.914 | 1.5 | 0.562 |
| 25.12.2019 | 1.03 | 1.69 | 0.452 |
© Bayerisches Landesamt für Umwelt 2024