

Chart of year Hammer / Oberteisendorfer Ache
Discharge from 27.11.2021 to 26.11.2022
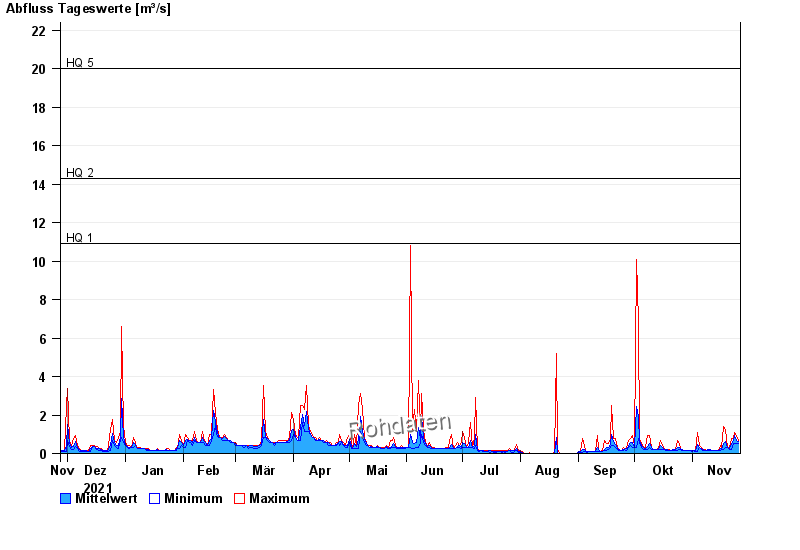
- HQ1 10,9 m³/s
- HQ2 14,3 m³/s
- HQ5 20 m³/s
- HQ10 25 m³/s
- HQ20 30 m³/s
- HQ50 39 m³/s
- HQ100 43 m³/s
| Date | Mean value [m³/s] | Maximum [m³/s] | Minimum [m³/s] |
|---|---|---|---|
| 26.11.2022 | 0.622 | 0.656 | 0.526 |
| 25.11.2022 | 0.673 | 0.938 | 0.526 |
| 24.11.2022 | 0.93 | 1.09 | 0.526 |
| 23.11.2022 | 0.685 | 0.795 | 0.526 |
| 22.11.2022 | 0.471 | 0.795 | 0.23 |
| 21.11.2022 | 0.252 | 0.307 | 0.23 |
| 20.11.2022 | 0.307 | 0.307 | 0.307 |
© Bayerisches Landesamt für Umwelt 2024