

Chart of year Hammer / Oberteisendorfer Ache
Discharge from 27.11.2020 to 26.11.2021
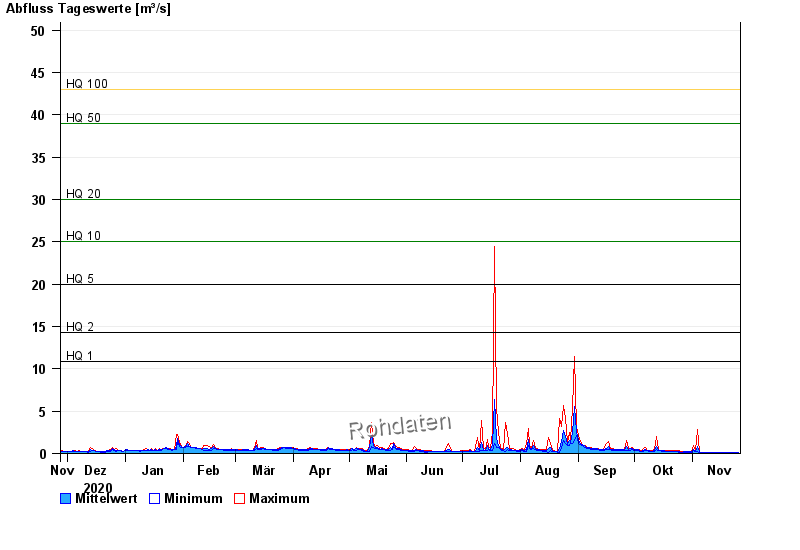
- HQ1 10,9 m³/s
- HQ2 14,3 m³/s
- HQ5 20 m³/s
- HQ10 25 m³/s
- HQ20 30 m³/s
- HQ50 39 m³/s
- HQ100 43 m³/s
| Date | Mean value [m³/s] | Maximum [m³/s] | Minimum [m³/s] |
|---|---|---|---|
| 26.11.2021 | 0.122 | 0.16 | 0.093 |
| 25.11.2021 | 0.119 | 0.16 | 0.093 |
| 24.11.2021 | 0.118 | 0.122 | 0.093 |
| 23.11.2021 | 0.123 | 0.16 | 0.093 |
| 22.11.2021 | 0.116 | 0.16 | 0.093 |
| 21.11.2021 | 0.114 | 0.122 | 0.093 |
| 20.11.2021 | 0.119 | 0.16 | 0.093 |
© Bayerisches Landesamt für Umwelt 2024