

Chart of total period Hammer / Oberteisendorfer Ache
Discharge from 01.11.1964 to 18.04.2024
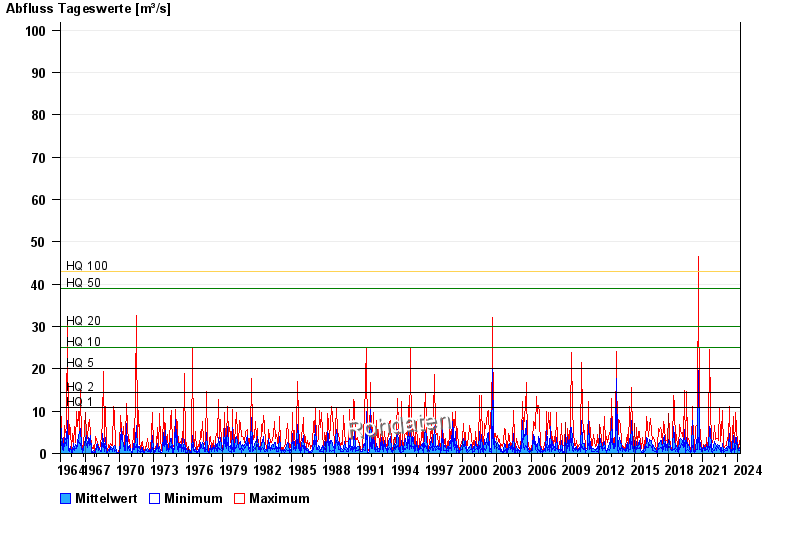
- HQ1 10,9 m³/s
- HQ2 14,3 m³/s
- HQ5 20 m³/s
- HQ10 25 m³/s
- HQ20 30 m³/s
- HQ50 39 m³/s
- HQ100 43 m³/s
| Date | Mean value [m³/s] | Maximum [m³/s] | Minimum [m³/s] |
|---|---|---|---|
| 18.04.2024 | 0.622 | 0.622 | 0.622 |
| 17.04.2024 | 0.504 | 0.75 | 0.285 |
| 16.04.2024 | 0.38 | 0.389 | 0.285 |
| 15.04.2024 | 0.405 | 0.622 | 0.285 |
| 14.04.2024 | 0.315 | 0.389 | 0.285 |
| 13.04.2024 | 0.322 | 0.389 | 0.285 |
| 12.04.2024 | 0.33 | 0.389 | 0.285 |
© Bayerisches Landesamt für Umwelt 2024