
- Start >
- Rivers >
- Discharge >
- Isar >
- Großschwindau >
- Chart of year

Chart of year Großschwindau / Goldach
Discharge from 01.01.2022 to 31.12.2022
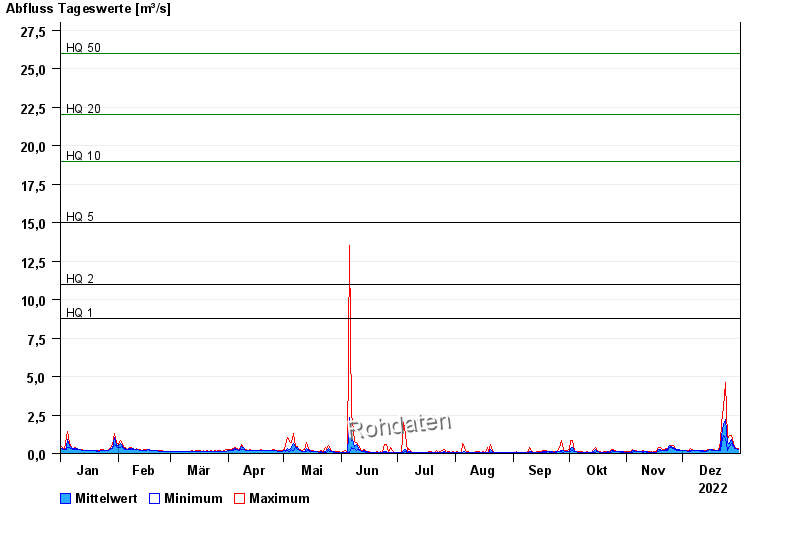
- HQ1 8,8 m³/s
- HQ2 11 m³/s
- HQ5 15 m³/s
- HQ10 19 m³/s
- HQ20 22 m³/s
- HQ50 26 m³/s
- HQ100 29 m³/s
| Date | Mean value [m³/s] | Maximum [m³/s] | Minimum [m³/s] |
|---|---|---|---|
| 31.12.2022 | 0.265 | 0.296 | 0.253 |
| 30.12.2022 | 0.31 | 0.34 | 0.296 |
| 29.12.2022 | 0.378 | 0.439 | 0.34 |
| 28.12.2022 | 0.518 | 0.661 | 0.439 |
| 27.12.2022 | 0.907 | 1.18 | 0.661 |
| 26.12.2022 | 0.633 | 1.18 | 0.439 |
| 25.12.2022 | 0.686 | 0.97 | 0.214 |
© Bayerisches Landesamt für Umwelt 2024