
- Start >
- Rivers >
- Discharge >
- Isar >
- Großschwindau >
- Chart of year

Chart of year Großschwindau / Goldach
Discharge from 27.05.2020 to 26.05.2021
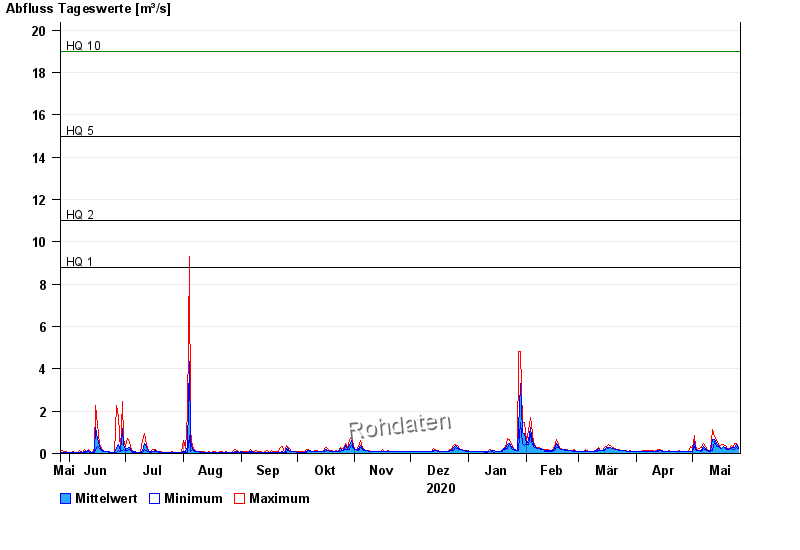
- HQ1 8,8 m³/s
- HQ2 11 m³/s
- HQ5 15 m³/s
- HQ10 19 m³/s
- HQ20 22 m³/s
- HQ50 26 m³/s
- HQ100 29 m³/s
| Date | Mean value [m³/s] | Maximum [m³/s] | Minimum [m³/s] |
|---|---|---|---|
| 26.05.2021 | 0.267 | 0.285 | 0.244 |
| 25.05.2021 | 0.416 | 0.478 | 0.285 |
| 24.05.2021 | 0.263 | 0.478 | 0.206 |
| 23.05.2021 | 0.276 | 0.329 | 0.206 |
| 22.05.2021 | 0.306 | 0.376 | 0.244 |
| 21.05.2021 | 0.202 | 0.244 | 0.172 |
| 20.05.2021 | 0.213 | 0.23 | 0.193 |
© Bayerisches Landesamt für Umwelt 2024