

Chart of total period Gaden / Schinderbach
Discharge from 01.11.1977 to 25.04.2024
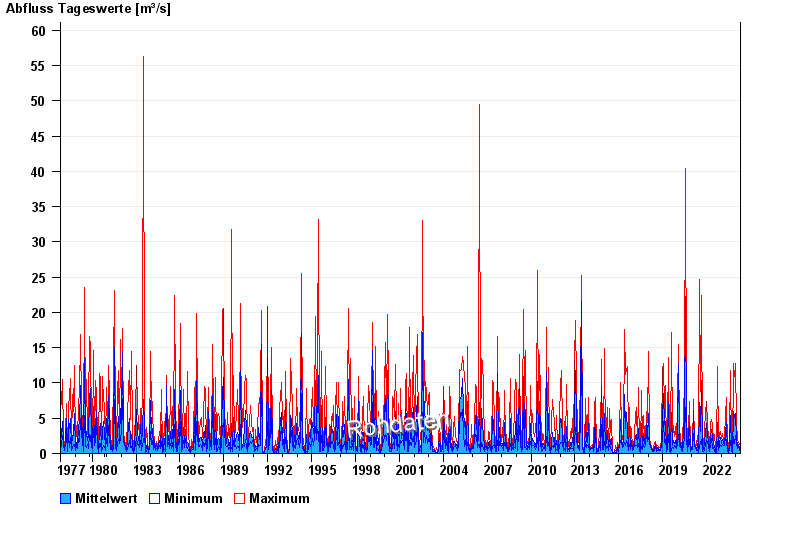
note
Datenabruf nur 07:00, 15:00 und 23:00 MEZ
| Date | Mean value [m³/s] | Maximum [m³/s] | Minimum [m³/s] |
|---|---|---|---|
| 25.04.2024 | 0.503 | 0.558 | 0.418 |
| 24.04.2024 | 0.631 | 0.707 | 0.486 |
| 23.04.2024 | 0.489 | 0.558 | 0.418 |
| 22.04.2024 | 0.758 | 0.865 | 0.558 |
| 21.04.2024 | 0.825 | 0.948 | 0.707 |
| 20.04.2024 | 0.719 | 0.865 | 0.558 |
| 19.04.2024 | 0.227 | 0.631 | 0.192 |
© Bayerisches Landesamt für Umwelt 2024