
- Start >
- Rivers >
- Discharge >
- Isar >
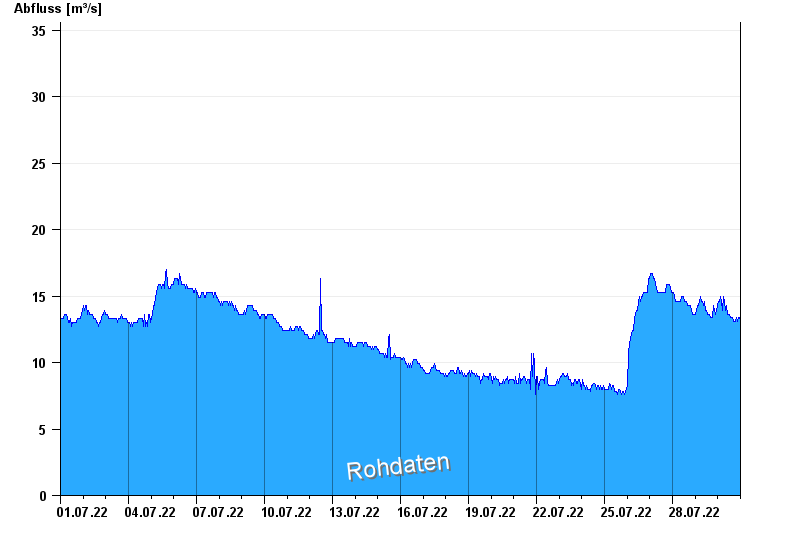
- Fürstenfeldbruck >
- Chart of month

Chart of month Fürstenfeldbruck / Amper
Discharge from 01.07.2022 to 30.07.2022
- HQ1 55 m³/s
- HQ2 64 m³/s
- HQ5 75 m³/s
- HQ10 90 m³/s
- HQ20 106 m³/s
- HQ50 130 m³/s
- HQ100 150 m³/s
| Date | Runoff [m³/s] |
|---|---|
| 31.07.2022 00:45 | 13.4 |
| 31.07.2022 00:30 | 13.4 |
| 31.07.2022 00:15 | 13.4 |
| 31.07.2022 00:00 | 13.1 |
| 30.07.2022 23:45 | 13.1 |
| 30.07.2022 23:30 | 13.1 |
| 30.07.2022 23:15 | 13.1 |
© Bayerisches Landesamt für Umwelt 2024