

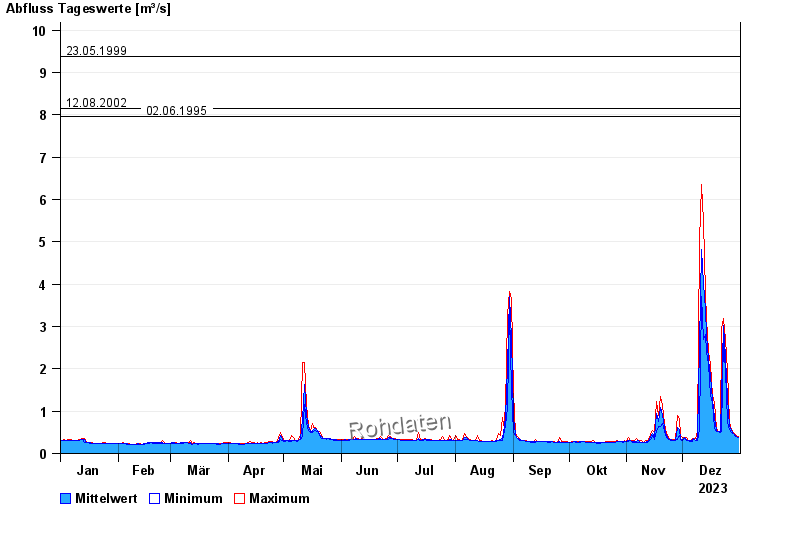
Chart of year Freising / Schleifermoosach
Discharge from 01.01.2023 to 31.12.2023
- 02.06.2013 Abfluss: 16,1 m³/s
- 24.08.2005 Abfluss: 10,9 m³/s
- 23.05.1999 Abfluss: 9,37 m³/s
- 12.08.2002 Abfluss: 8,15 m³/s
- 02.06.1995 Abfluss: 7,97 m³/s
| Date | Mean value [m³/s] | Maximum [m³/s] | Minimum [m³/s] |
|---|---|---|---|
| 31.12.2023 | 0.384 | 0.401 | 0.373 |
| 30.12.2023 | 0.405 | 0.431 | 0.401 |
| 29.12.2023 | 0.438 | 0.462 | 0.431 |
| 28.12.2023 | 0.473 | 0.493 | 0.462 |
| 27.12.2023 | 0.534 | 0.56 | 0.493 |
| 26.12.2023 | 0.64 | 0.732 | 0.56 |
| 25.12.2023 | 1.3 | 1.95 | 0.732 |
© Bayerisches Landesamt für Umwelt 2024