

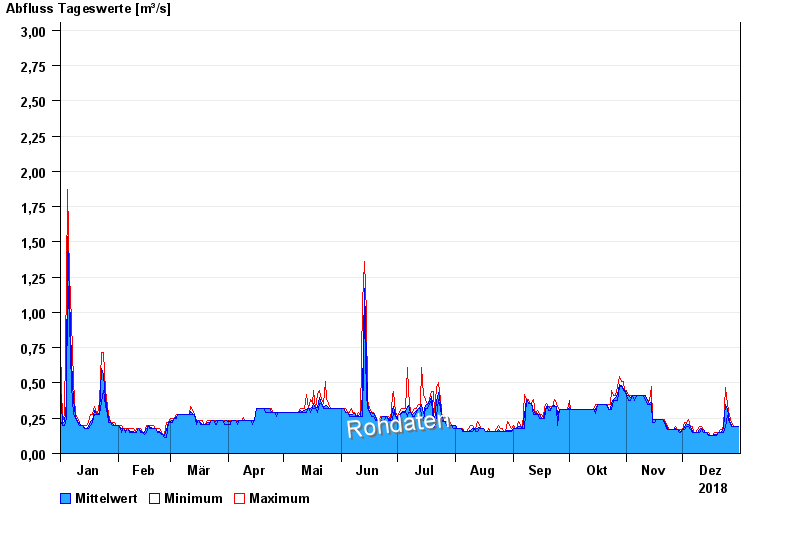
Chart of year Freising / Schleifermoosach
Discharge from 01.01.2018 to 31.12.2018
- 02.06.2013 Abfluss: 16,1 m³/s
- 24.08.2005 Abfluss: 10,9 m³/s
- 23.05.1999 Abfluss: 9,37 m³/s
- 12.08.2002 Abfluss: 8,15 m³/s
- 02.06.1995 Abfluss: 7,97 m³/s
| Date | Mean value [m³/s] | Maximum [m³/s] | Minimum [m³/s] |
|---|---|---|---|
| 31.12.2018 | 0.194 | 0.194 | 0.194 |
| 30.12.2018 | 0.194 | 0.194 | 0.194 |
| 29.12.2018 | 0.194 | 0.194 | 0.194 |
| 28.12.2018 | 0.194 | 0.194 | 0.194 |
| 27.12.2018 | 0.199 | 0.218 | 0.194 |
| 26.12.2018 | 0.231 | 0.27 | 0.218 |
| 25.12.2018 | 0.309 | 0.349 | 0.27 |
© Bayerisches Landesamt für Umwelt 2024