

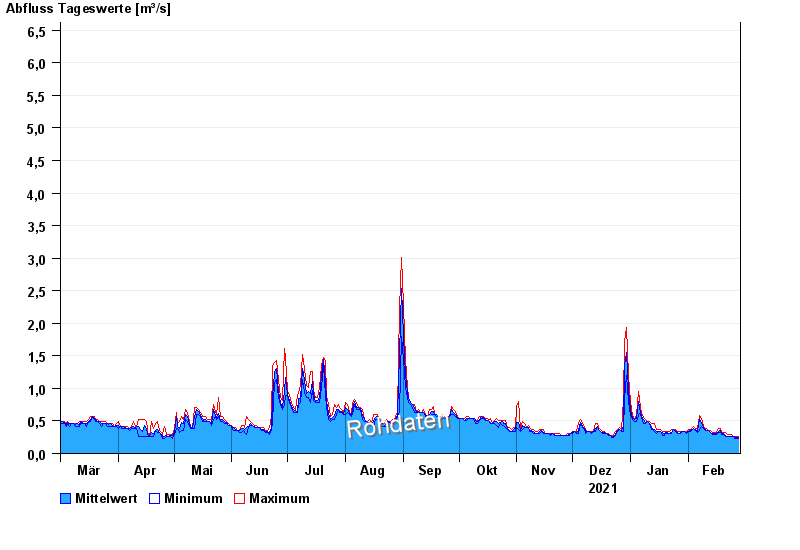
Chart of year Freising / Schleifermoosach
Discharge from 01.03.2021 to 28.02.2022
 Für diesen Pegel sind keine Jährlichkeiten hinterlegt.
| Date | Mean value [m³/s] | Maximum [m³/s] | Minimum [m³/s] |
|---|---|---|---|
| 28.02.2022 | 0.239 | 0.259 | 0.231 |
| 27.02.2022 | 0.251 | 0.259 | 0.231 |
| 26.02.2022 | 0.259 | 0.259 | 0.231 |
| 25.02.2022 | 0.259 | 0.259 | 0.259 |
| 24.02.2022 | 0.26 | 0.287 | 0.259 |
| 23.02.2022 | 0.259 | 0.287 | 0.259 |
| 22.02.2022 | 0.259 | 0.287 | 0.259 |
© Bayerisches Landesamt für Umwelt 2024