

Chart of total period Freising / Isar
Discharge from 01.11.1950 to 20.04.2024
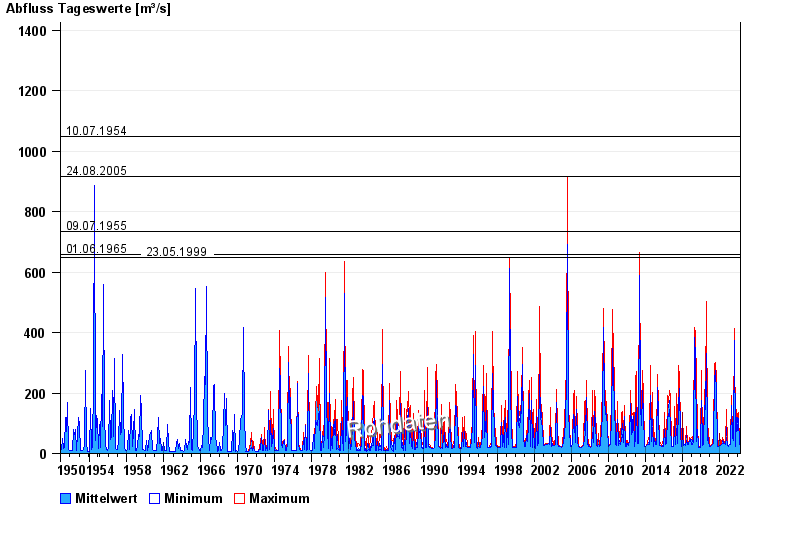
- 10.07.1954 Abfluss: 1050 m³/s
- 24.08.2005 Abfluss: 916 m³/s
- 09.07.1955 Abfluss: 735 m³/s
- 01.06.1965 Abfluss: 658 m³/s
- 23.05.1999 Abfluss: 649 m³/s
| Date | Mean value [m³/s] | Maximum [m³/s] | Minimum [m³/s] |
|---|---|---|---|
| 20.04.2024 | 31.9 | 31.9 | 31.9 |
| 19.04.2024 | 31.2 | 31.9 | 30.1 |
| 18.04.2024 | 31.2 | 31.9 | 30.1 |
| 17.04.2024 | 31.1 | 31.9 | 29.5 |
| 16.04.2024 | 31 | 31.9 | 29.5 |
| 15.04.2024 | 30.9 | 31.9 | 29.5 |
| 14.04.2024 | 30.3 | 31.3 | 29.5 |
© Bayerisches Landesamt für Umwelt 2024