
- Start >
- Rivers >
- Discharge >
- Isar >
- Eschenlohe Brücke >
- Chart of total period

Chart of total period Eschenlohe Brücke / Loisach
Discharge from 15.09.2007 to 20.04.2024
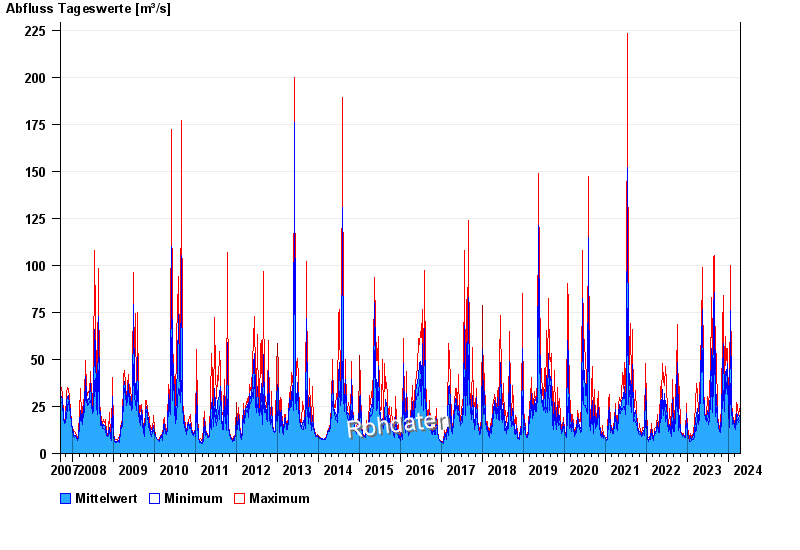
note
Messwerte beeinflusst durch Kraftwerkssteuerungen.
| Date | Mean value [m³/s] | Maximum [m³/s] | Minimum [m³/s] |
|---|---|---|---|
| 20.04.2024 | 17.4 | 17.6 | 17.1 |
| 19.04.2024 | 16.6 | 17.1 | 16 |
| 18.04.2024 | 17.7 | 18.8 | 17.1 |
| 17.04.2024 | 18.3 | 20 | 17.1 |
| 16.04.2024 | 19.4 | 21.2 | 17.6 |
| 15.04.2024 | 19 | 21.2 | 17.6 |
| 14.04.2024 | 17.7 | 19.3 | 16.6 |
© Bayerisches Landesamt für Umwelt 2024