

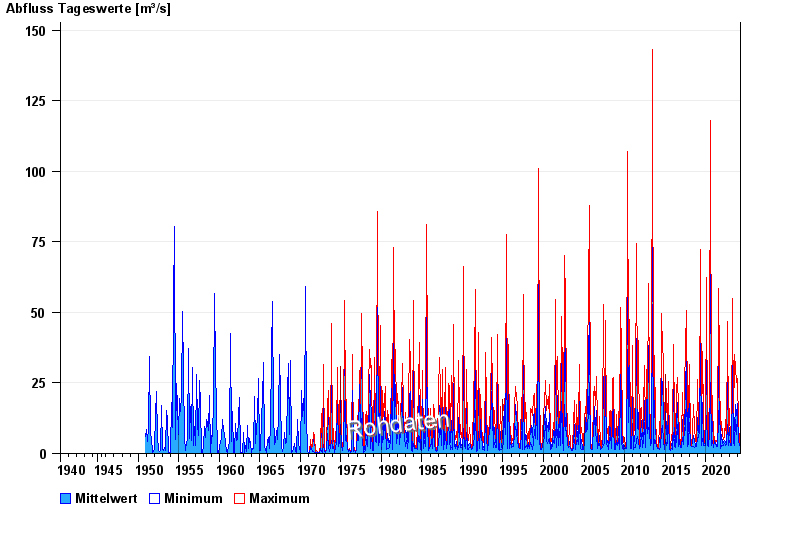
Chart of total period Erb / Leitzach
Discharge from 27.05.1940 to 23.04.2024
| Date | Mean value [m³/s] | Maximum [m³/s] | Minimum [m³/s] |
|---|---|---|---|
| 23.04.2024 | 2.76 | 2.76 | 2.76 |
| 22.04.2024 | 2.76 | 2.76 | 2.55 |
| 21.04.2024 | 2.71 | 2.76 | 2.55 |
| 20.04.2024 | 2.63 | 2.97 | 2.36 |
| 19.04.2024 | 2.2 | 2.36 | 2.16 |
| 18.04.2024 | 2.16 | 2.16 | 2.16 |
| 17.04.2024 | 2.11 | 2.16 | 1.98 |
© Bayerisches Landesamt für Umwelt 2024