

Chart of year Eching / Windach
Discharge from 01.01.2024 to 19.04.2024
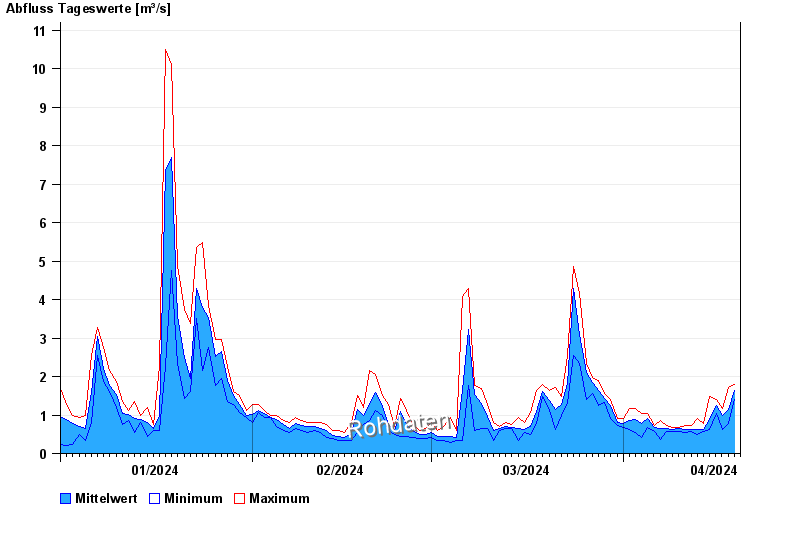
note
Pegel beeinflusst durch Kraftwerkssteuerung
| Date | Mean value [m³/s] | Maximum [m³/s] | Minimum [m³/s] |
|---|---|---|---|
| 19.04.2024 | 1.61 | 1.72 | 1.4 |
| 18.04.2024 | 1.14 | 1.72 | 0.789 |
| 17.04.2024 | 0.995 | 1.18 | 0.628 |
| 16.04.2024 | 1.26 | 1.4 | 1.04 |
| 15.04.2024 | 0.89 | 1.47 | 0.628 |
| 14.04.2024 | 0.631 | 0.789 | 0.583 |
| 13.04.2024 | 0.635 | 0.91 | 0.489 |
© Bayerisches Landesamt für Umwelt 2024