

Chart of year Eching / Windach
Discharge from 01.01.2024 to 25.04.2024
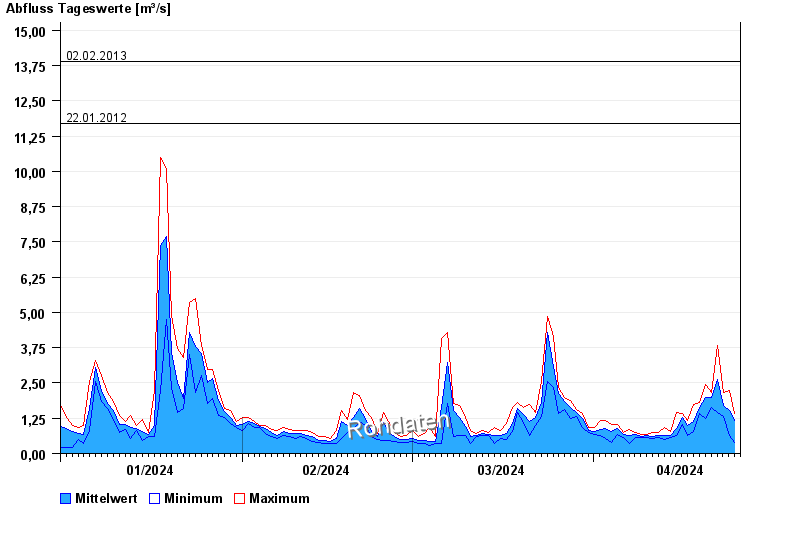
note
Pegel beeinflusst durch Kraftwerkssteuerung
- 02.06.2013 Abfluss: 48 m³/s
- 06.01.2013 Abfluss: 19,8 m³/s
- 23.10.2014 Abfluss: 19,3 m³/s
- 02.02.2013 Abfluss: 13,9 m³/s
- 22.01.2012 Abfluss: 11,7 m³/s
| Date | Mean value [m³/s] | Maximum [m³/s] | Minimum [m³/s] |
|---|---|---|---|
| 25.04.2024 | 1.17 | 1.4 | 0.407 |
| 24.04.2024 | 1.53 | 2.25 | 0.628 |
| 23.04.2024 | 1.71 | 2.16 | 1.32 |
| 22.04.2024 | 2.61 | 3.82 | 1.47 |
| 21.04.2024 | 1.99 | 2.16 | 1.64 |
| 20.04.2024 | 1.97 | 2.45 | 1.25 |
| 19.04.2024 | 1.63 | 1.8 | 1.4 |
© Bayerisches Landesamt für Umwelt 2024