

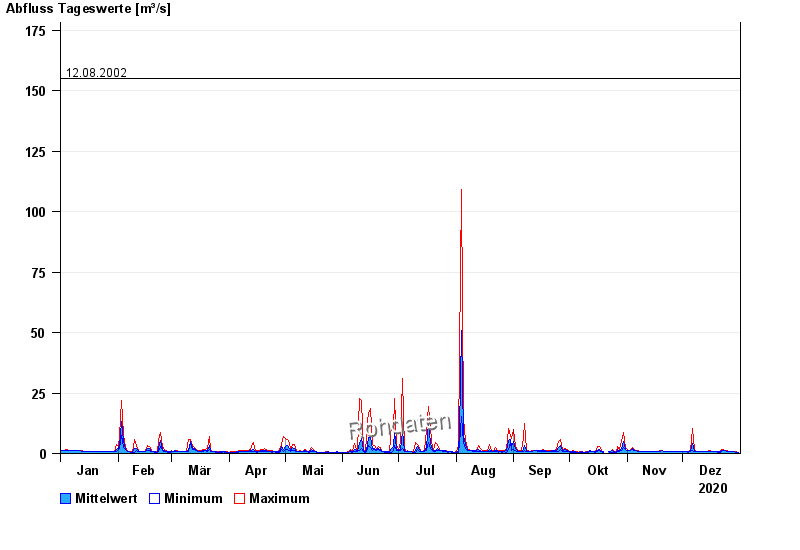
Chart of year Dürrach / Dürrach
Discharge from 01.01.2020 to 31.12.2020
Beeinflussung
Wasserstand durch starke Aufkiesung beeinflusst, der Abfluss ist ungültig
- 23.08.2005 Abfluss: 349 m³/s
- 22.05.1999 Abfluss: 291 m³/s
- 01.08.1977 Abfluss: 237 m³/s
- 03.06.2010 Abfluss: 194 m³/s
- 12.08.2002 Abfluss: 155 m³/s
| Date | Mean value [m³/s] | Maximum [m³/s] | Minimum [m³/s] |
|---|---|---|---|
| 31.12.2020 | 0.55 | 0.574 | 0.538 |
| 30.12.2020 | 0.598 | 0.653 | 0.574 |
| 29.12.2020 | 0.666 | 0.692 | 0.653 |
| 28.12.2020 | 0.727 | 0.732 | 0.692 |
| 27.12.2020 | 0.714 | 0.732 | 0.692 |
| 26.12.2020 | 0.803 | 0.867 | 0.732 |
| 25.12.2020 | 0.978 | 1.06 | 0.867 |
© Bayerisches Landesamt für Umwelt 2024