

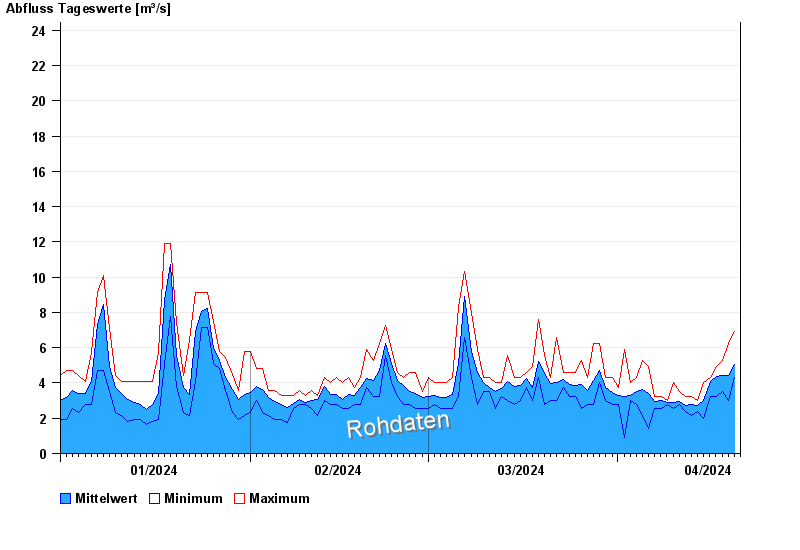
Chart of year Druisheim / Schmutter
Discharge from 01.01.2024 to 20.04.2024
- HQ1 26 m³/s
- HQ2 30 m³/s
- HQ5 45 m³/s
- HQ10 55 m³/s
- HQ20 66 m³/s
- HQ50 81 m³/s
- HQ100 90 m³/s
| Date | Mean value [m³/s] | Maximum [m³/s] | Minimum [m³/s] |
|---|---|---|---|
| 20.04.2024 | 5.3 | 6.59 | 4.32 |
| 19.04.2024 | 4.41 | 6.26 | 3.01 |
| 18.04.2024 | 4.4 | 5.25 | 3.5 |
| 17.04.2024 | 4.37 | 4.93 | 3.24 |
| 16.04.2024 | 4.06 | 4.32 | 3.24 |
| 15.04.2024 | 2.99 | 4.03 | 2 |
| 14.04.2024 | 2.7 | 3.01 | 2.36 |
© Bayerisches Landesamt für Umwelt 2024