

Chart of total period Dasing / Paar
Discharge from 01.11.1958 to 25.04.2024
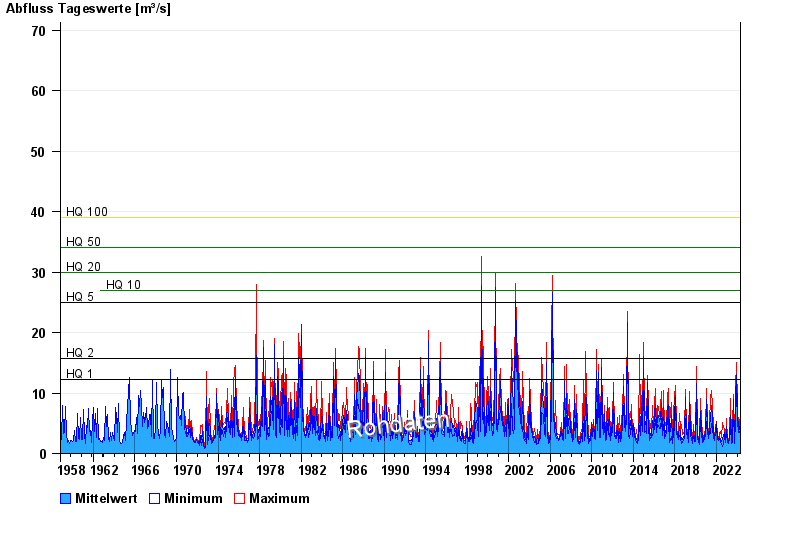
- HQ1 12,2 m³/s
- HQ2 15,7 m³/s
- HQ5 25 m³/s
- HQ10 27 m³/s
- HQ20 30 m³/s
- HQ50 34 m³/s
- HQ100 39 m³/s
| Date | Mean value [m³/s] | Maximum [m³/s] | Minimum [m³/s] |
|---|---|---|---|
| 25.04.2024 | 2.49 | 2.61 | 2.31 |
| 24.04.2024 | 2.51 | 2.69 | 2.38 |
| 23.04.2024 | 2.61 | 2.69 | 2.53 |
| 22.04.2024 | 2.7 | 2.84 | 2.61 |
| 21.04.2024 | 2.78 | 2.92 | 2.61 |
| 20.04.2024 | 3.1 | 3.5 | 2.84 |
| 19.04.2024 | 3.12 | 3.33 | 3.01 |
© Bayerisches Landesamt für Umwelt 2024