
- Start >
- Rivers >
- Discharge >
- Isar >
- Beyharting >
- Chart of year

Chart of year Beyharting / Glonn
Discharge from 18.09.2021 to 17.09.2022
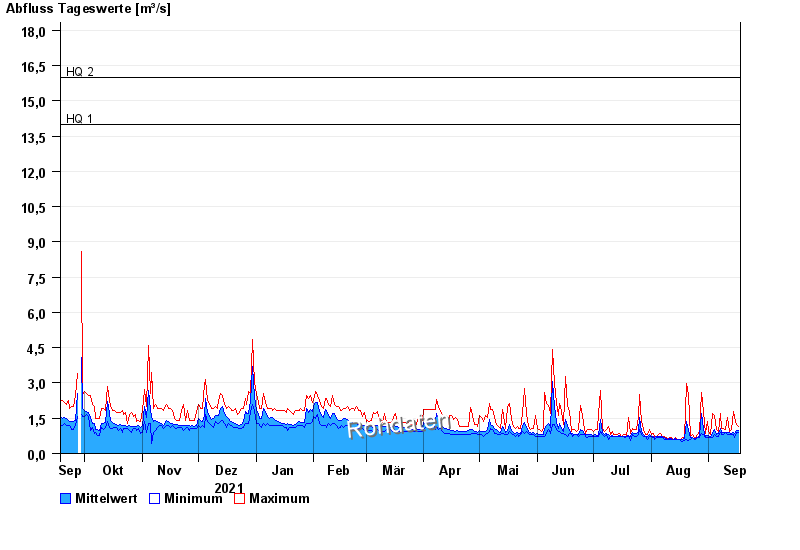
- HQ1 14 m³/s
- HQ2 16 m³/s
- HQ5 19 m³/s
- HQ10 24 m³/s
- HQ20 29 m³/s
- HQ50 35 m³/s
- HQ100 40 m³/s
| Date | Mean value [m³/s] | Maximum [m³/s] | Minimum [m³/s] |
|---|---|---|---|
| 17.09.2022 | 0.973 | 1.16 | 0.876 |
| 16.09.2022 | 0.994 | 1.23 | 0.876 |
| 15.09.2022 | 0.868 | 1.54 | 0.681 |
| 14.09.2022 | 0.882 | 1.79 | 0.807 |
| 13.09.2022 | 0.833 | 1.01 | 0.807 |
| 12.09.2022 | 0.878 | 0.942 | 0.807 |
| 11.09.2022 | 0.903 | 1.54 | 0.807 |
© Bayerisches Landesamt für Umwelt 2024