

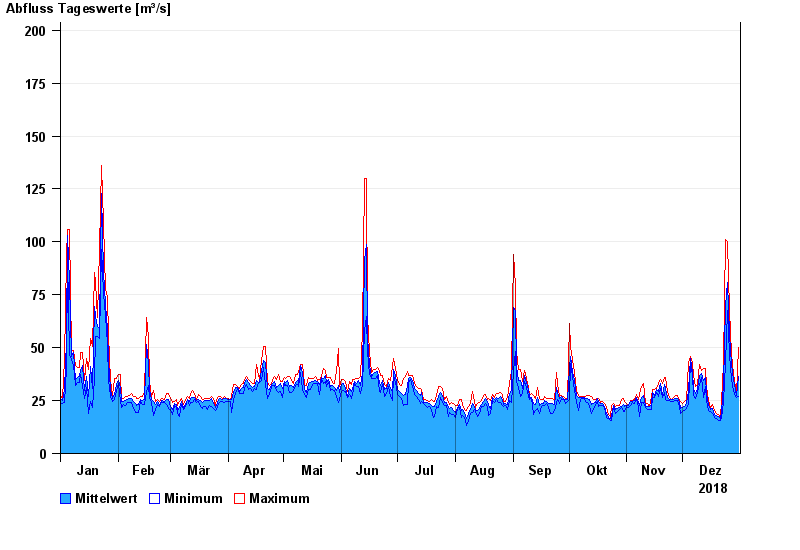
Chart of year Beuerberg / Loisach
Discharge from 01.01.2018 to 31.12.2018
- 24.05.1999 Abfluss: 319 m³/s
- 23.08.2005 Abfluss: 310 m³/s
- 03.06.2013 Abfluss: 300 m³/s
- 10.08.1970 Abfluss: 281 m³/s
- 18.06.1979 Abfluss: 280 m³/s
| Date | Mean value [m³/s] | Maximum [m³/s] | Minimum [m³/s] |
|---|---|---|---|
| 31.12.2018 | 36.5 | 50.1 | 27.1 |
| 30.12.2018 | 27.2 | 28.1 | 26.5 |
| 29.12.2018 | 32.5 | 34.7 | 28.1 |
| 28.12.2018 | 34.6 | 37.4 | 30 |
| 27.12.2018 | 42 | 46.6 | 35 |
| 26.12.2018 | 56.3 | 67.8 | 46.6 |
| 25.12.2018 | 80.8 | 100 | 67.8 |
© Bayerisches Landesamt für Umwelt 2024