

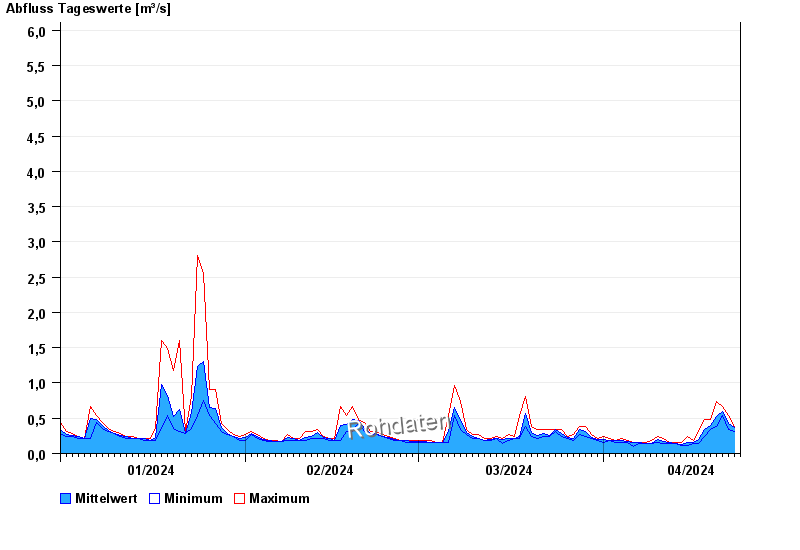
Chart of year Bairawies / Zeller Bach
Discharge from 01.01.2024 to 23.04.2024
- HQ1 9 m³/s
- HQ2 12 m³/s
- HQ5 16 m³/s
- HQ10 20 m³/s
- HQ20 24 m³/s
- HQ50 30 m³/s
- HQ100 35 m³/s
| Date | Mean value [m³/s] | Maximum [m³/s] | Minimum [m³/s] |
|---|---|---|---|
| 23.04.2024 | 0.346 | 0.389 | 0.307 |
| 22.04.2024 | 0.429 | 0.539 | 0.347 |
| 21.04.2024 | 0.597 | 0.663 | 0.539 |
| 20.04.2024 | 0.53 | 0.73 | 0.389 |
| 19.04.2024 | 0.395 | 0.486 | 0.347 |
| 18.04.2024 | 0.337 | 0.486 | 0.238 |
| 17.04.2024 | 0.192 | 0.307 | 0.14 |
© Bayerisches Landesamt für Umwelt 2024