
- Start >
- Rivers >
- Discharge >
- Isar >
- Bad Wiessee >
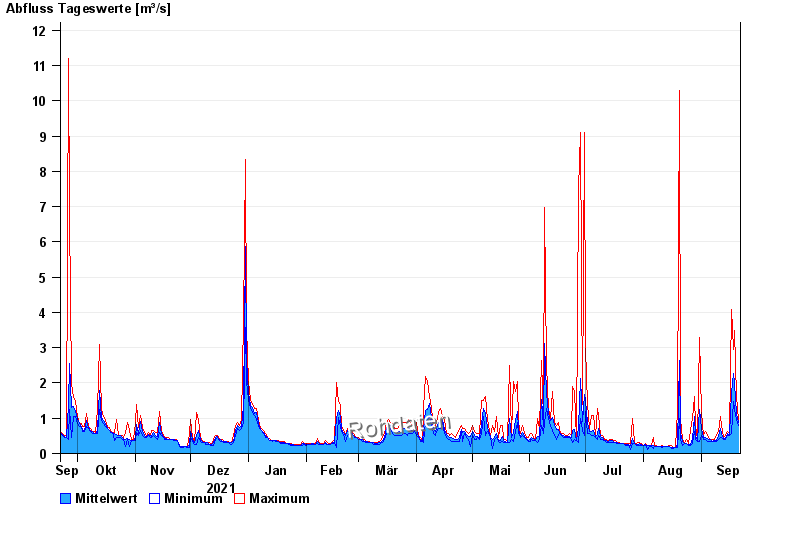
- Chart of year

Chart of year Bad Wiessee / Söllbach
Discharge from 22.09.2021 to 21.09.2022
| Date | Mean value [m³/s] | Maximum [m³/s] | Minimum [m³/s] |
|---|---|---|---|
| 21.09.2022 | 0.865 | 0.96 | 0.784 |
| 20.09.2022 | 1.12 | 1.61 | 0.96 |
| 19.09.2022 | 1.98 | 3.48 | 1.26 |
| 18.09.2022 | 2.26 | 2.94 | 1.48 |
| 17.09.2022 | 1.74 | 4.08 | 0.566 |
| 16.09.2022 | 0.532 | 0.566 | 0.503 |
| 15.09.2022 | 0.574 | 0.633 | 0.503 |
© Bayerisches Landesamt für Umwelt 2024