
- Start >
- Rivers >
- Discharge >
- Isar >
- Bad Wiessee >
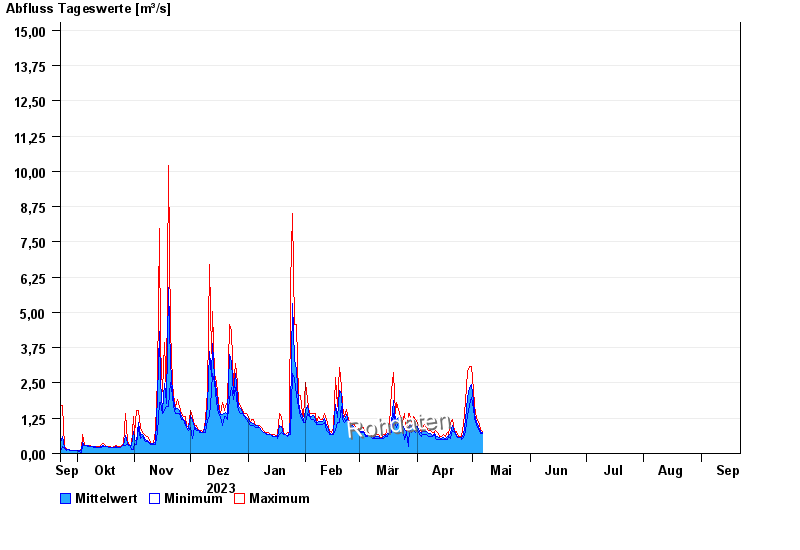
- Chart of year

Chart of year Bad Wiessee / Söllbach
Discharge from 22.09.2023 to 21.09.2024
- 21.05.1999 Abfluss: 44,1 m³/s
- 02.06.2013 Abfluss: 40,5 m³/s
- 23.08.2005 Abfluss: 29,8 m³/s
- 03.06.2010 Abfluss: 28,7 m³/s
- 12.08.2002 Abfluss: 27,4 m³/s
| Date | Mean value [m³/s] | Maximum [m³/s] | Minimum [m³/s] |
|---|---|---|---|
| 24.04.2024 | 0.604 | 0.604 | 0.604 |
| 23.04.2024 | 0.626 | 0.673 | 0.604 |
| 22.04.2024 | 0.697 | 0.83 | 0.673 |
| 21.04.2024 | 0.777 | 0.83 | 0.75 |
| 20.04.2024 | 0.984 | 1.21 | 0.83 |
| 19.04.2024 | 0.705 | 1.11 | 0.538 |
| 18.04.2024 | 0.623 | 0.673 | 0.604 |
© Bayerisches Landesamt für Umwelt 2024