
- Start >
- Rivers >
- Discharge >
- Isar >
- Bad Wiessee >
- Chart of year

Chart of year Bad Wiessee / Söllbach
Discharge from 16.11.2019 to 15.11.2020
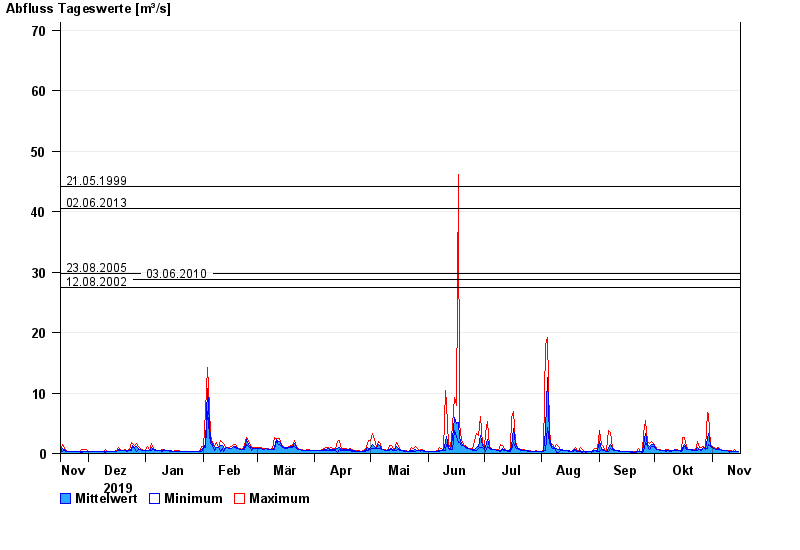
- 21.05.1999 Abfluss: 44,1 m³/s
- 02.06.2013 Abfluss: 40,5 m³/s
- 23.08.2005 Abfluss: 29,8 m³/s
- 03.06.2010 Abfluss: 28,7 m³/s
- 12.08.2002 Abfluss: 27,4 m³/s
| Date | Mean value [m³/s] | Maximum [m³/s] | Minimum [m³/s] |
|---|---|---|---|
| 15.11.2020 | 0.303 | 0.345 | 0.299 |
| 14.11.2020 | 0.332 | 0.353 | 0.304 |
| 13.11.2020 | 0.364 | 0.721 | 0.353 |
| 12.11.2020 | 0.365 | 0.413 | 0.359 |
| 11.11.2020 | 0.403 | 0.42 | 0.365 |
| 10.11.2020 | 0.41 | 0.423 | 0.184 |
| 09.11.2020 | 0.45 | 0.476 | 0.423 |
© Bayerisches Landesamt für Umwelt 2024