
- Start >
- Rivers >
- Discharge >
- Isar >
- Bad Wiessee >
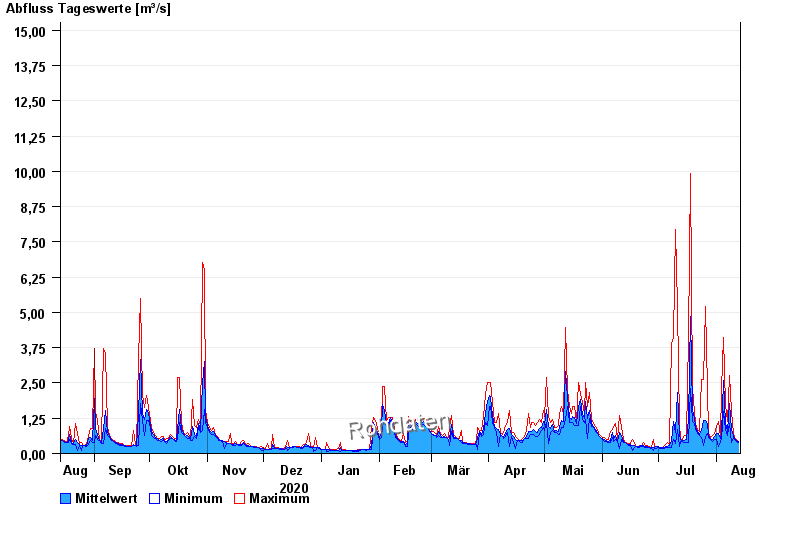
- Chart of year

Chart of year Bad Wiessee / Söllbach
Discharge from 14.08.2020 to 13.08.2021
- 21.05.1999 Abfluss: 44,1 m³/s
- 02.06.2013 Abfluss: 40,5 m³/s
- 23.08.2005 Abfluss: 29,8 m³/s
- 03.06.2010 Abfluss: 28,7 m³/s
- 12.08.2002 Abfluss: 27,4 m³/s
| Date | Mean value [m³/s] | Maximum [m³/s] | Minimum [m³/s] |
|---|---|---|---|
| 13.08.2021 | 0.416 | 0.438 | 0.387 |
| 12.08.2021 | 0.468 | 0.495 | 0.438 |
| 11.08.2021 | 0.531 | 0.557 | 0.495 |
| 10.08.2021 | 0.655 | 0.698 | 0.557 |
| 09.08.2021 | 0.865 | 1.48 | 0.387 |
| 08.08.2021 | 1.77 | 2.78 | 1.05 |
| 07.08.2021 | 0.786 | 1.15 | 0.626 |
© Bayerisches Landesamt für Umwelt 2024