
- Start >
- Rivers >
- Discharge >
- Isar >
- Bad Wiessee >
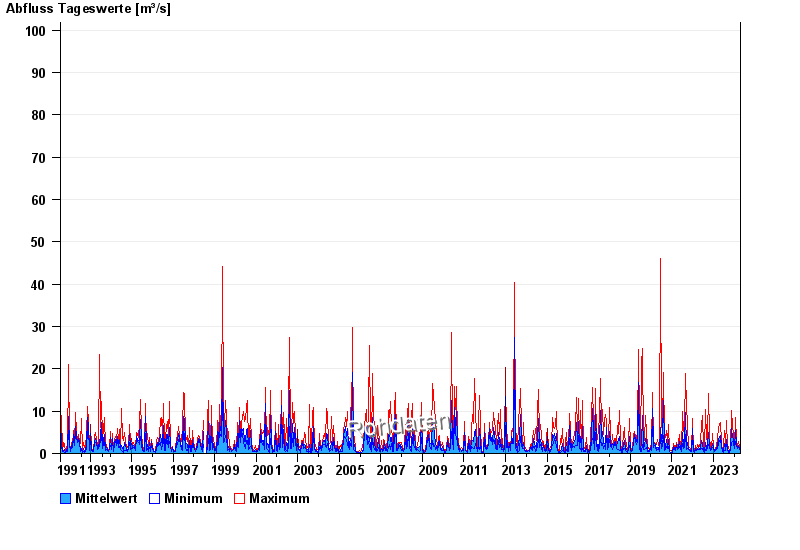
- Chart of total period

Chart of total period Bad Wiessee / Söllbach
Discharge from 01.08.1991 to 23.04.2024
 Für diesen Pegel sind keine Jährlichkeiten hinterlegt.
| Date | Mean value [m³/s] | Maximum [m³/s] | Minimum [m³/s] |
|---|---|---|---|
| 23.04.2024 | 0.632 | 0.673 | 0.604 |
| 22.04.2024 | 0.697 | 0.83 | 0.673 |
| 21.04.2024 | 0.777 | 0.83 | 0.75 |
| 20.04.2024 | 0.984 | 1.21 | 0.83 |
| 19.04.2024 | 0.705 | 1.11 | 0.538 |
| 18.04.2024 | 0.623 | 0.673 | 0.604 |
| 17.04.2024 | 0.615 | 0.75 | 0.48 |
© Bayerisches Landesamt für Umwelt 2024