
- Start >
- Rivers >
- Discharge >
- Isar >
- Bad Wiessee >
- Chart of total period

Chart of total period Bad Wiessee / Zeiselbach
Discharge from 01.11.1987 to 20.04.2024
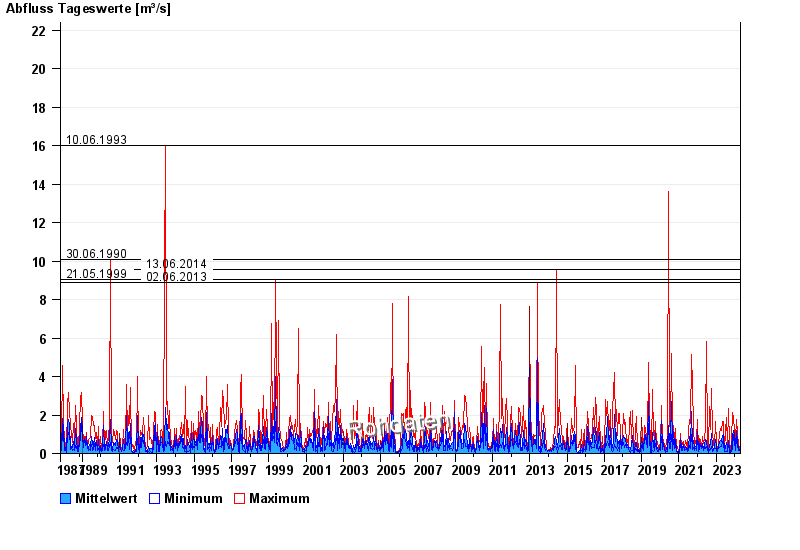
- 10.06.1993 Abfluss: 16 m³/s
- 30.06.1990 Abfluss: 10,1 m³/s
- 13.06.2014 Abfluss: 9,54 m³/s
- 21.05.1999 Abfluss: 9,06 m³/s
- 02.06.2013 Abfluss: 8,89 m³/s
| Date | Mean value [m³/s] | Maximum [m³/s] | Minimum [m³/s] |
|---|---|---|---|
| 20.04.2024 | 0.255 | 0.277 | 0.21 |
| 19.04.2024 | 0.142 | 0.277 | 0.113 |
| 18.04.2024 | 0.11 | 0.133 | 0.095 |
| 17.04.2024 | 0.098 | 0.133 | 0.065 |
| 16.04.2024 | 0.066 | 0.079 | 0.053 |
| 15.04.2024 | 0.064 | 0.079 | 0.053 |
| 14.04.2024 | 0.065 | 0.065 | 0.053 |
© Bayerisches Landesamt für Umwelt 2024