

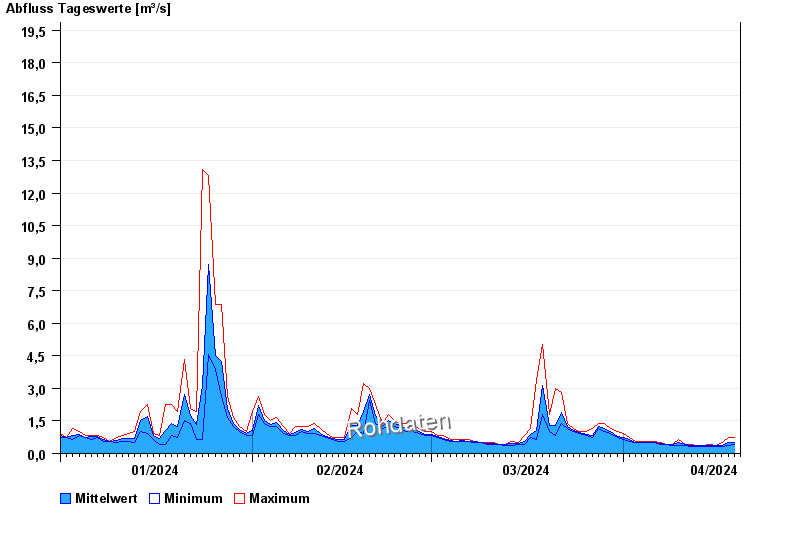
Chart of year Bad Trißl / Auerbach
Discharge from 01.01.2024 to 19.04.2024
- 31.07.1977 Abfluss: 90,6 m³/s
- 21.05.1999 Abfluss: 79 m³/s
- 20.07.1981 Abfluss: 75,8 m³/s
- 12.08.2002 Abfluss: 73,3 m³/s
- 24.08.1955 Abfluss: 70,9 m³/s
| Date | Mean value [m³/s] | Maximum [m³/s] | Minimum [m³/s] |
|---|---|---|---|
| 19.04.2024 | 0.496 | 0.567 | 0.435 |
| 18.04.2024 | 0.497 | 0.724 | 0.379 |
| 17.04.2024 | 0.385 | 0.498 | 0.326 |
| 16.04.2024 | 0.352 | 0.379 | 0.326 |
| 15.04.2024 | 0.356 | 0.435 | 0.326 |
| 14.04.2024 | 0.354 | 0.379 | 0.326 |
| 13.04.2024 | 0.376 | 0.379 | 0.326 |
© Bayerisches Landesamt für Umwelt 2024