

Chart of year Bad Trißl / Auerbach
Discharge from 01.01.2020 to 31.12.2020
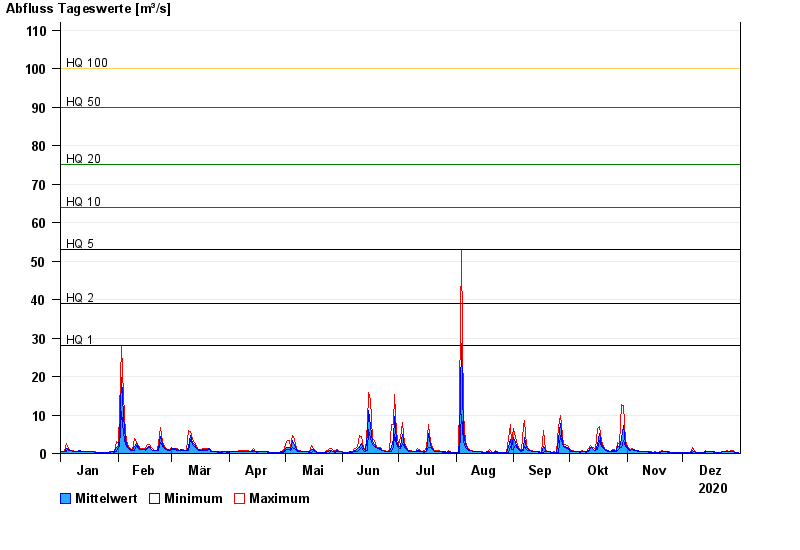
- HQ1 28 m³/s
- HQ2 39 m³/s
- HQ5 53 m³/s
- HQ10 64 m³/s
- HQ20 75 m³/s
- HQ50 90 m³/s
- HQ100 100 m³/s
| Date | Mean value [m³/s] | Maximum [m³/s] | Minimum [m³/s] |
|---|---|---|---|
| 31.12.2020 | 0.337 | 0.366 | 0.314 |
| 30.12.2020 | 0.365 | 0.366 | 0.365 |
| 29.12.2020 | 0.389 | 0.422 | 0.365 |
| 28.12.2020 | 0.537 | 0.801 | 0.422 |
| 27.12.2020 | 0.609 | 0.801 | 0.422 |
| 26.12.2020 | 0.53 | 0.629 | 0.485 |
| 25.12.2020 | 0.643 | 0.711 | 0.553 |
© Bayerisches Landesamt für Umwelt 2024