

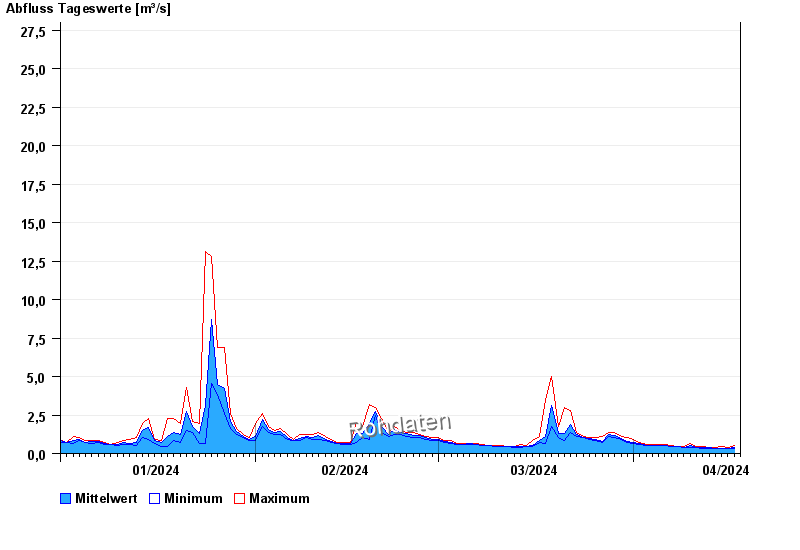
Chart of year Bad Trißl / Auerbach
Discharge from 01.01.2024 to 17.04.2024
- HQ1 28 m³/s
- HQ2 39 m³/s
- HQ5 53 m³/s
- HQ10 64 m³/s
- HQ20 75 m³/s
- HQ50 90 m³/s
- HQ100 100 m³/s
| Date | Mean value [m³/s] | Maximum [m³/s] | Minimum [m³/s] |
|---|---|---|---|
| 17.04.2024 | 0.347 | 0.435 | 0.326 |
| 16.04.2024 | 0.352 | 0.379 | 0.326 |
| 15.04.2024 | 0.356 | 0.435 | 0.326 |
| 14.04.2024 | 0.354 | 0.379 | 0.326 |
| 13.04.2024 | 0.376 | 0.379 | 0.326 |
| 12.04.2024 | 0.385 | 0.435 | 0.326 |
| 11.04.2024 | 0.41 | 0.435 | 0.379 |
© Bayerisches Landesamt für Umwelt 2024