

Chart of year Bad Tölz / Ellbach
Discharge from 01.01.2020 to 31.12.2020
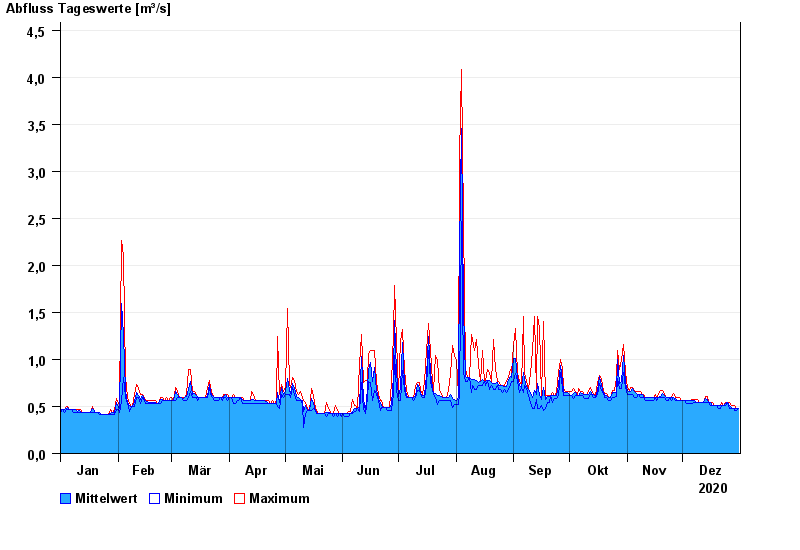
| Date | Mean value [m³/s] | Maximum [m³/s] | Minimum [m³/s] |
|---|---|---|---|
| 31.12.2020 | 0.483 | 0.483 | 0.483 |
| 30.12.2020 | 0.482 | 0.483 | 0.454 |
| 29.12.2020 | 0.482 | 0.512 | 0.453 |
| 28.12.2020 | 0.482 | 0.512 | 0.482 |
| 27.12.2020 | 0.488 | 0.511 | 0.482 |
| 26.12.2020 | 0.513 | 0.542 | 0.481 |
| 25.12.2020 | 0.542 | 0.542 | 0.542 |
© Bayerisches Landesamt für Umwelt 2024